Immigrants from Russia vs Cajun Male Unemployment
COMPARE
Immigrants from Russia
Cajun
Male Unemployment
Male Unemployment Comparison
Immigrants from Russia
Cajuns
5.3%
MALE UNEMPLOYMENT
50.7/ 100
METRIC RATING
173rd/ 347
METRIC RANK
5.8%
MALE UNEMPLOYMENT
0.1/ 100
METRIC RATING
259th/ 347
METRIC RANK
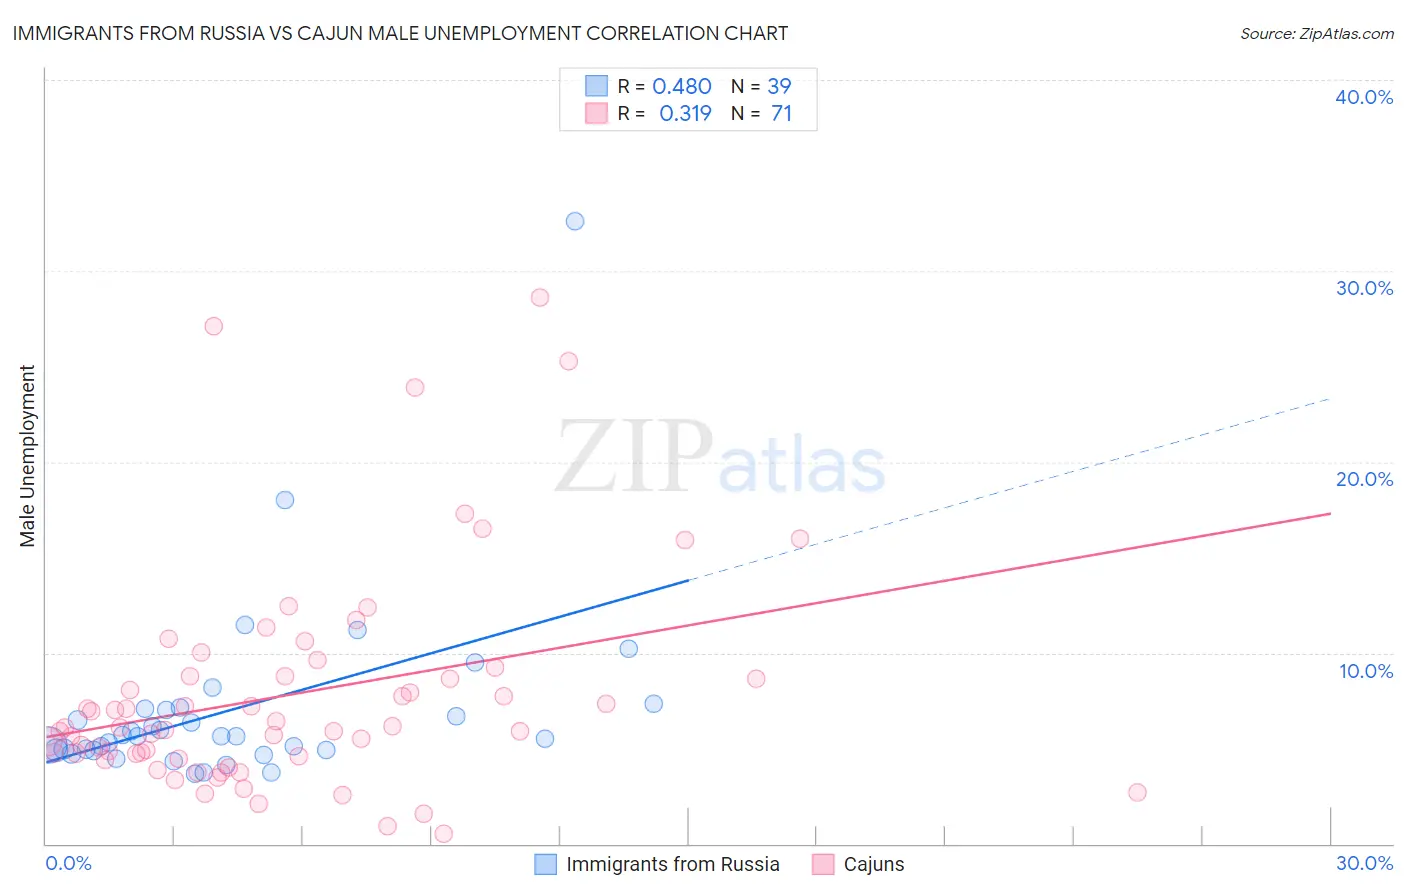
Immigrants from Russia vs Cajun Male Unemployment Correlation Chart
The statistical analysis conducted on geographies consisting of 346,725,771 people shows a moderate positive correlation between the proportion of Immigrants from Russia and unemployment rate among males in the United States with a correlation coefficient (R) of 0.480 and weighted average of 5.3%. Similarly, the statistical analysis conducted on geographies consisting of 149,208,256 people shows a mild positive correlation between the proportion of Cajuns and unemployment rate among males in the United States with a correlation coefficient (R) of 0.319 and weighted average of 5.8%, a difference of 10.0%.
Male Unemployment Correlation Summary
| Measurement | Immigrants from Russia | Cajun |
| Minimum | 3.7% | 0.50% |
| Maximum | 32.6% | 28.6% |
| Range | 28.9% | 28.1% |
| Mean | 7.0% | 7.8% |
| Median | 5.6% | 6.1% |
| Interquartile 25% (IQ1) | 4.9% | 4.6% |
| Interquartile 75% (IQ3) | 7.1% | 8.8% |
| Interquartile Range (IQR) | 2.2% | 4.2% |
| Standard Deviation (Sample) | 5.0% | 5.8% |
| Standard Deviation (Population) | 4.9% | 5.7% |
Similar Demographics by Male Unemployment
Demographics Similar to Immigrants from Russia by Male Unemployment
In terms of male unemployment, the demographic groups most similar to Immigrants from Russia are Immigrants from Kazakhstan (5.3%, a difference of 0.010%), Immigrants from Iran (5.3%, a difference of 0.040%), Peruvian (5.3%, a difference of 0.070%), Immigrants from Iraq (5.3%, a difference of 0.15%), and Immigrants from Eastern Europe (5.3%, a difference of 0.20%).
| Demographics | Rating | Rank | Male Unemployment |
| Immigrants | Morocco | 60.2 /100 | #166 | Good 5.3% |
| Immigrants | Vietnam | 58.1 /100 | #167 | Average 5.3% |
| Immigrants | Ireland | 57.7 /100 | #168 | Average 5.3% |
| Immigrants | Congo | 57.4 /100 | #169 | Average 5.3% |
| Immigrants | Eastern Europe | 54.1 /100 | #170 | Average 5.3% |
| Peruvians | 51.9 /100 | #171 | Average 5.3% |
| Immigrants | Kazakhstan | 50.8 /100 | #172 | Average 5.3% |
| Immigrants | Russia | 50.7 /100 | #173 | Average 5.3% |
| Immigrants | Iran | 50.0 /100 | #174 | Average 5.3% |
| Immigrants | Iraq | 48.1 /100 | #175 | Average 5.3% |
| Immigrants | Poland | 46.0 /100 | #176 | Average 5.3% |
| Immigrants | Peru | 44.6 /100 | #177 | Average 5.3% |
| Osage | 42.5 /100 | #178 | Average 5.3% |
| Immigrants | Oceania | 40.8 /100 | #179 | Average 5.3% |
| Malaysians | 39.6 /100 | #180 | Fair 5.3% |
Demographics Similar to Cajuns by Male Unemployment
In terms of male unemployment, the demographic groups most similar to Cajuns are Immigrants from Central America (5.8%, a difference of 0.060%), Dutch West Indian (5.8%, a difference of 0.15%), Liberian (5.8%, a difference of 0.24%), Hispanic or Latino (5.8%, a difference of 0.29%), and Comanche (5.8%, a difference of 0.46%).
| Demographics | Rating | Rank | Male Unemployment |
| Mexicans | 0.2 /100 | #252 | Tragic 5.8% |
| Mexican American Indians | 0.2 /100 | #253 | Tragic 5.8% |
| Japanese | 0.2 /100 | #254 | Tragic 5.8% |
| Kiowa | 0.2 /100 | #255 | Tragic 5.8% |
| Comanche | 0.2 /100 | #256 | Tragic 5.8% |
| Hispanics or Latinos | 0.1 /100 | #257 | Tragic 5.8% |
| Dutch West Indians | 0.1 /100 | #258 | Tragic 5.8% |
| Cajuns | 0.1 /100 | #259 | Tragic 5.8% |
| Immigrants | Central America | 0.1 /100 | #260 | Tragic 5.8% |
| Liberians | 0.1 /100 | #261 | Tragic 5.8% |
| Immigrants | Portugal | 0.1 /100 | #262 | Tragic 5.9% |
| Immigrants | Latin America | 0.1 /100 | #263 | Tragic 5.9% |
| Immigrants | Mexico | 0.0 /100 | #264 | Tragic 5.9% |
| French American Indians | 0.0 /100 | #265 | Tragic 5.9% |
| Bahamians | 0.0 /100 | #266 | Tragic 5.9% |