Immigrants from Russia vs Pennsylvania German Male Unemployment
COMPARE
Immigrants from Russia
Pennsylvania German
Male Unemployment
Male Unemployment Comparison
Immigrants from Russia
Pennsylvania Germans
5.3%
MALE UNEMPLOYMENT
50.7/ 100
METRIC RATING
173rd/ 347
METRIC RANK
4.8%
MALE UNEMPLOYMENT
99.9/ 100
METRIC RATING
20th/ 347
METRIC RANK
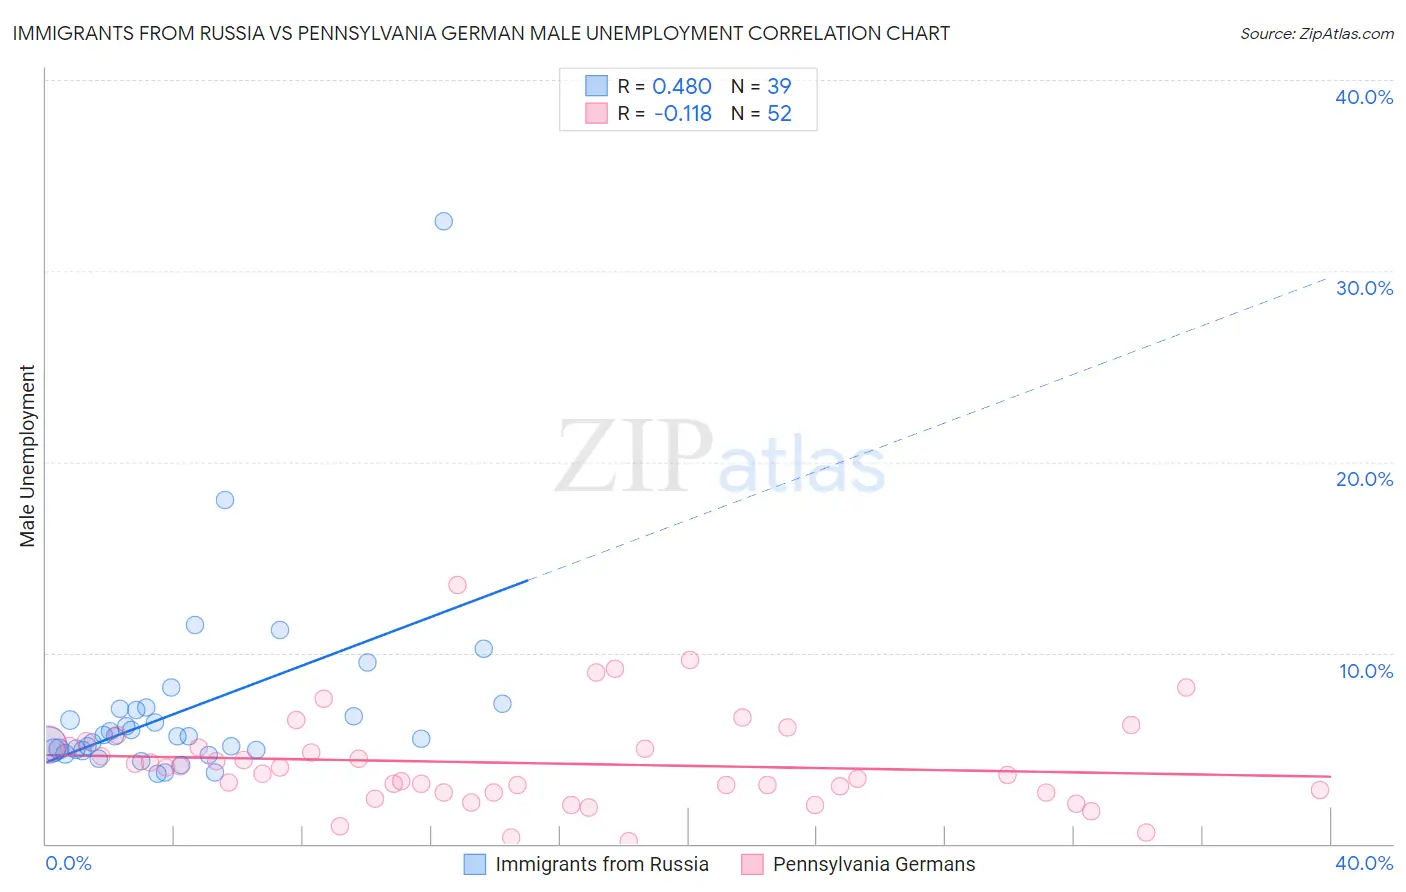
Immigrants from Russia vs Pennsylvania German Male Unemployment Correlation Chart
The statistical analysis conducted on geographies consisting of 346,725,771 people shows a moderate positive correlation between the proportion of Immigrants from Russia and unemployment rate among males in the United States with a correlation coefficient (R) of 0.480 and weighted average of 5.3%. Similarly, the statistical analysis conducted on geographies consisting of 232,803,431 people shows a poor negative correlation between the proportion of Pennsylvania Germans and unemployment rate among males in the United States with a correlation coefficient (R) of -0.118 and weighted average of 4.8%, a difference of 11.2%.
Male Unemployment Correlation Summary
| Measurement | Immigrants from Russia | Pennsylvania German |
| Minimum | 3.7% | 0.10% |
| Maximum | 32.6% | 13.5% |
| Range | 28.9% | 13.4% |
| Mean | 7.0% | 4.2% |
| Median | 5.6% | 3.8% |
| Interquartile 25% (IQ1) | 4.9% | 2.7% |
| Interquartile 75% (IQ3) | 7.1% | 5.2% |
| Interquartile Range (IQR) | 2.2% | 2.5% |
| Standard Deviation (Sample) | 5.0% | 2.5% |
| Standard Deviation (Population) | 4.9% | 2.5% |
Similar Demographics by Male Unemployment
Demographics Similar to Immigrants from Russia by Male Unemployment
In terms of male unemployment, the demographic groups most similar to Immigrants from Russia are Immigrants from Kazakhstan (5.3%, a difference of 0.010%), Immigrants from Iran (5.3%, a difference of 0.040%), Peruvian (5.3%, a difference of 0.070%), Immigrants from Iraq (5.3%, a difference of 0.15%), and Immigrants from Eastern Europe (5.3%, a difference of 0.20%).
| Demographics | Rating | Rank | Male Unemployment |
| Immigrants | Morocco | 60.2 /100 | #166 | Good 5.3% |
| Immigrants | Vietnam | 58.1 /100 | #167 | Average 5.3% |
| Immigrants | Ireland | 57.7 /100 | #168 | Average 5.3% |
| Immigrants | Congo | 57.4 /100 | #169 | Average 5.3% |
| Immigrants | Eastern Europe | 54.1 /100 | #170 | Average 5.3% |
| Peruvians | 51.9 /100 | #171 | Average 5.3% |
| Immigrants | Kazakhstan | 50.8 /100 | #172 | Average 5.3% |
| Immigrants | Russia | 50.7 /100 | #173 | Average 5.3% |
| Immigrants | Iran | 50.0 /100 | #174 | Average 5.3% |
| Immigrants | Iraq | 48.1 /100 | #175 | Average 5.3% |
| Immigrants | Poland | 46.0 /100 | #176 | Average 5.3% |
| Immigrants | Peru | 44.6 /100 | #177 | Average 5.3% |
| Osage | 42.5 /100 | #178 | Average 5.3% |
| Immigrants | Oceania | 40.8 /100 | #179 | Average 5.3% |
| Malaysians | 39.6 /100 | #180 | Fair 5.3% |
Demographics Similar to Pennsylvania Germans by Male Unemployment
In terms of male unemployment, the demographic groups most similar to Pennsylvania Germans are European (4.8%, a difference of 0.050%), English (4.8%, a difference of 0.080%), Immigrants from Taiwan (4.8%, a difference of 0.16%), Carpatho Rusyn (4.8%, a difference of 0.18%), and Tongan (4.8%, a difference of 0.22%).
| Demographics | Rating | Rank | Male Unemployment |
| Bolivians | 100.0 /100 | #13 | Exceptional 4.7% |
| Germans | 100.0 /100 | #14 | Exceptional 4.7% |
| Scandinavians | 100.0 /100 | #15 | Exceptional 4.7% |
| Swiss | 99.9 /100 | #16 | Exceptional 4.7% |
| Filipinos | 99.9 /100 | #17 | Exceptional 4.7% |
| English | 99.9 /100 | #18 | Exceptional 4.8% |
| Europeans | 99.9 /100 | #19 | Exceptional 4.8% |
| Pennsylvania Germans | 99.9 /100 | #20 | Exceptional 4.8% |
| Immigrants | Taiwan | 99.9 /100 | #21 | Exceptional 4.8% |
| Carpatho Rusyns | 99.9 /100 | #22 | Exceptional 4.8% |
| Tongans | 99.9 /100 | #23 | Exceptional 4.8% |
| Immigrants | South Central Asia | 99.9 /100 | #24 | Exceptional 4.8% |
| Zimbabweans | 99.9 /100 | #25 | Exceptional 4.8% |
| Dutch | 99.9 /100 | #26 | Exceptional 4.8% |
| Belgians | 99.9 /100 | #27 | Exceptional 4.8% |