Central American Indian vs Immigrants from Latin America Unemployment
COMPARE
Central American Indian
Immigrants from Latin America
Unemployment
Unemployment Comparison
Central American Indians
Immigrants from Latin America
6.2%
UNEMPLOYMENT
0.0/ 100
METRIC RATING
292nd/ 347
METRIC RANK
5.9%
UNEMPLOYMENT
0.0/ 100
METRIC RATING
275th/ 347
METRIC RANK
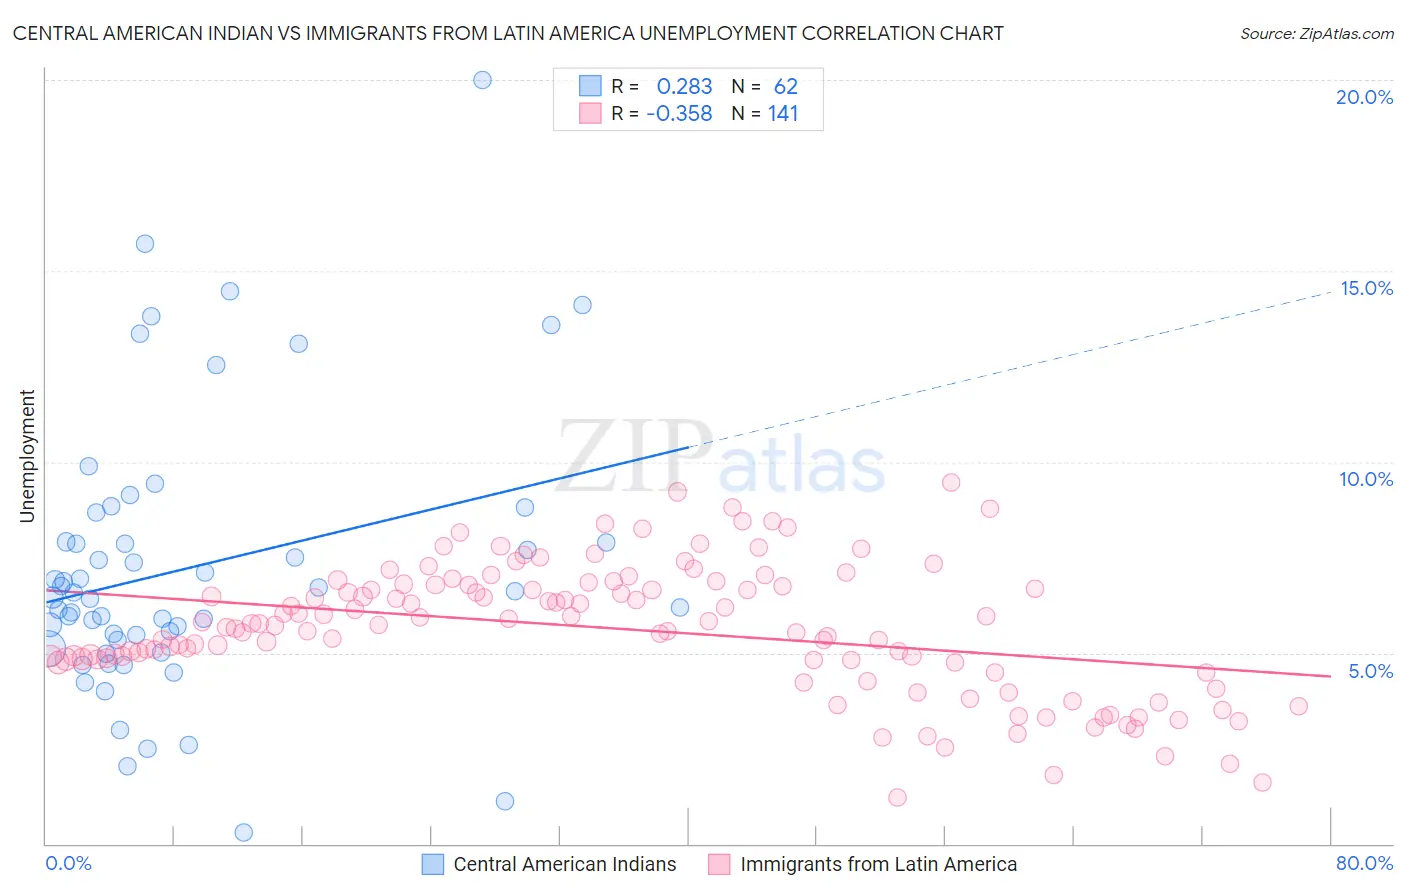
Central American Indian vs Immigrants from Latin America Unemployment Correlation Chart
The statistical analysis conducted on geographies consisting of 325,961,025 people shows a weak positive correlation between the proportion of Central American Indians and unemployment in the United States with a correlation coefficient (R) of 0.283 and weighted average of 6.2%. Similarly, the statistical analysis conducted on geographies consisting of 555,896,337 people shows a mild negative correlation between the proportion of Immigrants from Latin America and unemployment in the United States with a correlation coefficient (R) of -0.358 and weighted average of 5.9%, a difference of 5.0%.
Unemployment Correlation Summary
| Measurement | Central American Indian | Immigrants from Latin America |
| Minimum | 0.30% | 1.2% |
| Maximum | 20.0% | 9.5% |
| Range | 19.7% | 8.3% |
| Mean | 7.2% | 5.6% |
| Median | 6.5% | 5.7% |
| Interquartile 25% (IQ1) | 5.3% | 4.8% |
| Interquartile 75% (IQ3) | 7.9% | 6.8% |
| Interquartile Range (IQR) | 2.6% | 2.0% |
| Standard Deviation (Sample) | 3.6% | 1.7% |
| Standard Deviation (Population) | 3.6% | 1.7% |
Demographics Similar to Central American Indians and Immigrants from Latin America by Unemployment
In terms of unemployment, the demographic groups most similar to Central American Indians are Haitian (6.2%, a difference of 0.020%), Immigrants from Ecuador (6.2%, a difference of 0.090%), Senegalese (6.2%, a difference of 0.54%), Chippewa (6.2%, a difference of 0.64%), and Ecuadorian (6.2%, a difference of 0.99%). Similarly, the demographic groups most similar to Immigrants from Latin America are Bahamian (5.9%, a difference of 0.21%), Immigrants from Central America (6.0%, a difference of 0.28%), Immigrants from Fiji (5.9%, a difference of 0.50%), Armenian (6.0%, a difference of 0.63%), and Ghanaian (6.0%, a difference of 0.93%).
| Demographics | Rating | Rank | Unemployment |
| Immigrants | Fiji | 0.0 /100 | #273 | Tragic 5.9% |
| Bahamians | 0.0 /100 | #274 | Tragic 5.9% |
| Immigrants | Latin America | 0.0 /100 | #275 | Tragic 5.9% |
| Immigrants | Central America | 0.0 /100 | #276 | Tragic 6.0% |
| Armenians | 0.0 /100 | #277 | Tragic 6.0% |
| Ghanaians | 0.0 /100 | #278 | Tragic 6.0% |
| Immigrants | Mexico | 0.0 /100 | #279 | Tragic 6.0% |
| Immigrants | Western Africa | 0.0 /100 | #280 | Tragic 6.0% |
| Africans | 0.0 /100 | #281 | Tragic 6.1% |
| Immigrants | Azores | 0.0 /100 | #282 | Tragic 6.1% |
| Immigrants | Ghana | 0.0 /100 | #283 | Tragic 6.1% |
| Aleuts | 0.0 /100 | #284 | Tragic 6.1% |
| Immigrants | Senegal | 0.0 /100 | #285 | Tragic 6.1% |
| Immigrants | Caribbean | 0.0 /100 | #286 | Tragic 6.2% |
| Nepalese | 0.0 /100 | #287 | Tragic 6.2% |
| Ecuadorians | 0.0 /100 | #288 | Tragic 6.2% |
| Chippewa | 0.0 /100 | #289 | Tragic 6.2% |
| Senegalese | 0.0 /100 | #290 | Tragic 6.2% |
| Haitians | 0.0 /100 | #291 | Tragic 6.2% |
| Central American Indians | 0.0 /100 | #292 | Tragic 6.2% |
| Immigrants | Ecuador | 0.0 /100 | #293 | Tragic 6.2% |