Immigrants from Poland vs Osage Unemployment Among Seniors over 75 years
COMPARE
Immigrants from Poland
Osage
Unemployment Among Seniors over 75 years
Unemployment Among Seniors over 75 years Comparison
Immigrants from Poland
Osage
9.2%
UNEMPLOYMENT AMONG SENIORS OVER 75 YEARS
2.0/ 100
METRIC RATING
251st/ 347
METRIC RANK
8.9%
UNEMPLOYMENT AMONG SENIORS OVER 75 YEARS
25.4/ 100
METRIC RATING
200th/ 347
METRIC RANK
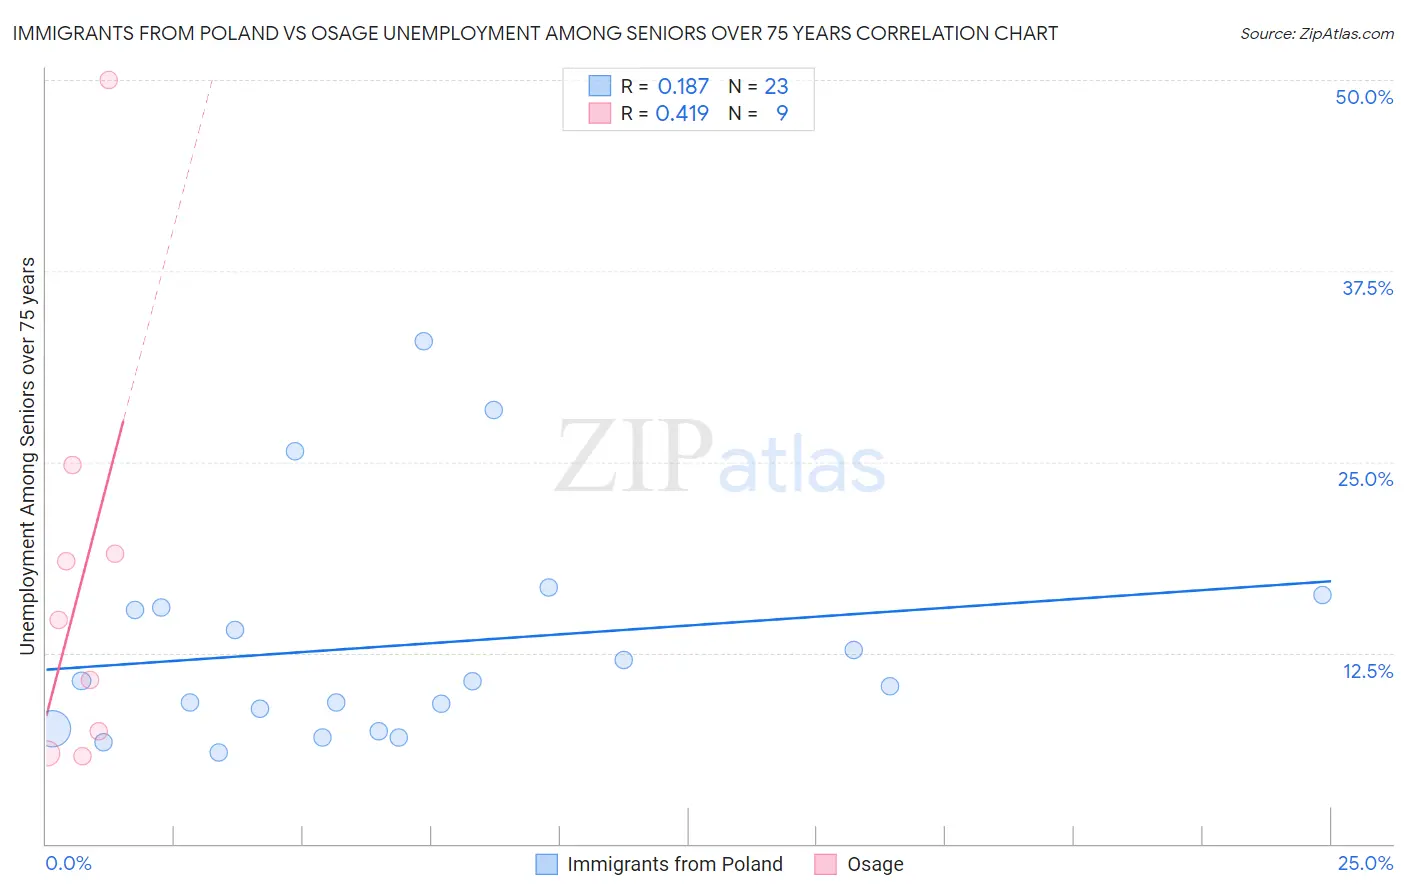
Immigrants from Poland vs Osage Unemployment Among Seniors over 75 years Correlation Chart
The statistical analysis conducted on geographies consisting of 170,667,519 people shows a poor positive correlation between the proportion of Immigrants from Poland and unemployment rate among seniors over the age of 75 in the United States with a correlation coefficient (R) of 0.187 and weighted average of 9.2%. Similarly, the statistical analysis conducted on geographies consisting of 70,055,038 people shows a moderate positive correlation between the proportion of Osage and unemployment rate among seniors over the age of 75 in the United States with a correlation coefficient (R) of 0.419 and weighted average of 8.9%, a difference of 3.7%.
Unemployment Among Seniors over 75 years Correlation Summary
| Measurement | Immigrants from Poland | Osage |
| Minimum | 5.9% | 5.8% |
| Maximum | 32.9% | 50.0% |
| Range | 27.0% | 44.2% |
| Mean | 13.0% | 17.4% |
| Median | 10.6% | 14.6% |
| Interquartile 25% (IQ1) | 7.6% | 6.6% |
| Interquartile 75% (IQ3) | 15.4% | 21.9% |
| Interquartile Range (IQR) | 7.9% | 15.3% |
| Standard Deviation (Sample) | 7.2% | 13.9% |
| Standard Deviation (Population) | 7.0% | 13.1% |
Similar Demographics by Unemployment Among Seniors over 75 years
Demographics Similar to Immigrants from Poland by Unemployment Among Seniors over 75 years
In terms of unemployment among seniors over 75 years, the demographic groups most similar to Immigrants from Poland are Immigrants from Sudan (9.2%, a difference of 0.030%), Central American Indian (9.2%, a difference of 0.10%), Immigrants from Saudi Arabia (9.2%, a difference of 0.11%), Blackfeet (9.2%, a difference of 0.15%), and Pima (9.2%, a difference of 0.16%).
| Demographics | Rating | Rank | Unemployment Among Seniors over 75 years |
| Immigrants | Germany | 2.7 /100 | #244 | Tragic 9.2% |
| Immigrants | Canada | 2.6 /100 | #245 | Tragic 9.2% |
| Immigrants | North America | 2.4 /100 | #246 | Tragic 9.2% |
| Sub-Saharan Africans | 2.3 /100 | #247 | Tragic 9.2% |
| Blackfeet | 2.3 /100 | #248 | Tragic 9.2% |
| Immigrants | Saudi Arabia | 2.2 /100 | #249 | Tragic 9.2% |
| Central American Indians | 2.2 /100 | #250 | Tragic 9.2% |
| Immigrants | Poland | 2.0 /100 | #251 | Tragic 9.2% |
| Immigrants | Sudan | 2.0 /100 | #252 | Tragic 9.2% |
| Pima | 1.8 /100 | #253 | Tragic 9.2% |
| Immigrants | Ghana | 1.7 /100 | #254 | Tragic 9.2% |
| Immigrants | Scotland | 1.4 /100 | #255 | Tragic 9.2% |
| Brazilians | 1.3 /100 | #256 | Tragic 9.3% |
| Hawaiians | 1.2 /100 | #257 | Tragic 9.3% |
| Immigrants | England | 1.0 /100 | #258 | Tragic 9.3% |
Demographics Similar to Osage by Unemployment Among Seniors over 75 years
In terms of unemployment among seniors over 75 years, the demographic groups most similar to Osage are Pakistani (8.9%, a difference of 0.0%), Eastern European (8.9%, a difference of 0.030%), Immigrants from Laos (8.9%, a difference of 0.060%), Immigrants from Peru (8.9%, a difference of 0.080%), and Russian (8.9%, a difference of 0.090%).
| Demographics | Rating | Rank | Unemployment Among Seniors over 75 years |
| Immigrants | Guyana | 29.9 /100 | #193 | Fair 8.8% |
| Maltese | 29.2 /100 | #194 | Fair 8.8% |
| Okinawans | 28.9 /100 | #195 | Fair 8.8% |
| Immigrants | Jamaica | 27.7 /100 | #196 | Fair 8.9% |
| Immigrants | Laos | 26.3 /100 | #197 | Fair 8.9% |
| Eastern Europeans | 25.9 /100 | #198 | Fair 8.9% |
| Pakistanis | 25.4 /100 | #199 | Fair 8.9% |
| Osage | 25.4 /100 | #200 | Fair 8.9% |
| Immigrants | Peru | 24.3 /100 | #201 | Fair 8.9% |
| Russians | 24.1 /100 | #202 | Fair 8.9% |
| Immigrants | Northern Europe | 23.9 /100 | #203 | Fair 8.9% |
| Spaniards | 22.0 /100 | #204 | Fair 8.9% |
| Koreans | 21.9 /100 | #205 | Fair 8.9% |
| Immigrants | Western Europe | 18.2 /100 | #206 | Poor 8.9% |
| Malaysians | 16.3 /100 | #207 | Poor 8.9% |