Immigrants from Poland vs Immigrants from Guyana Householder Income Under 25 years
COMPARE
Immigrants from Poland
Immigrants from Guyana
Householder Income Under 25 years
Householder Income Under 25 years Comparison
Immigrants from Poland
Immigrants from Guyana
$55,474
HOUSEHOLDER INCOME UNDER 25 YEARS
100.0/ 100
METRIC RATING
53rd/ 347
METRIC RANK
$55,726
HOUSEHOLDER INCOME UNDER 25 YEARS
100.0/ 100
METRIC RATING
41st/ 347
METRIC RANK
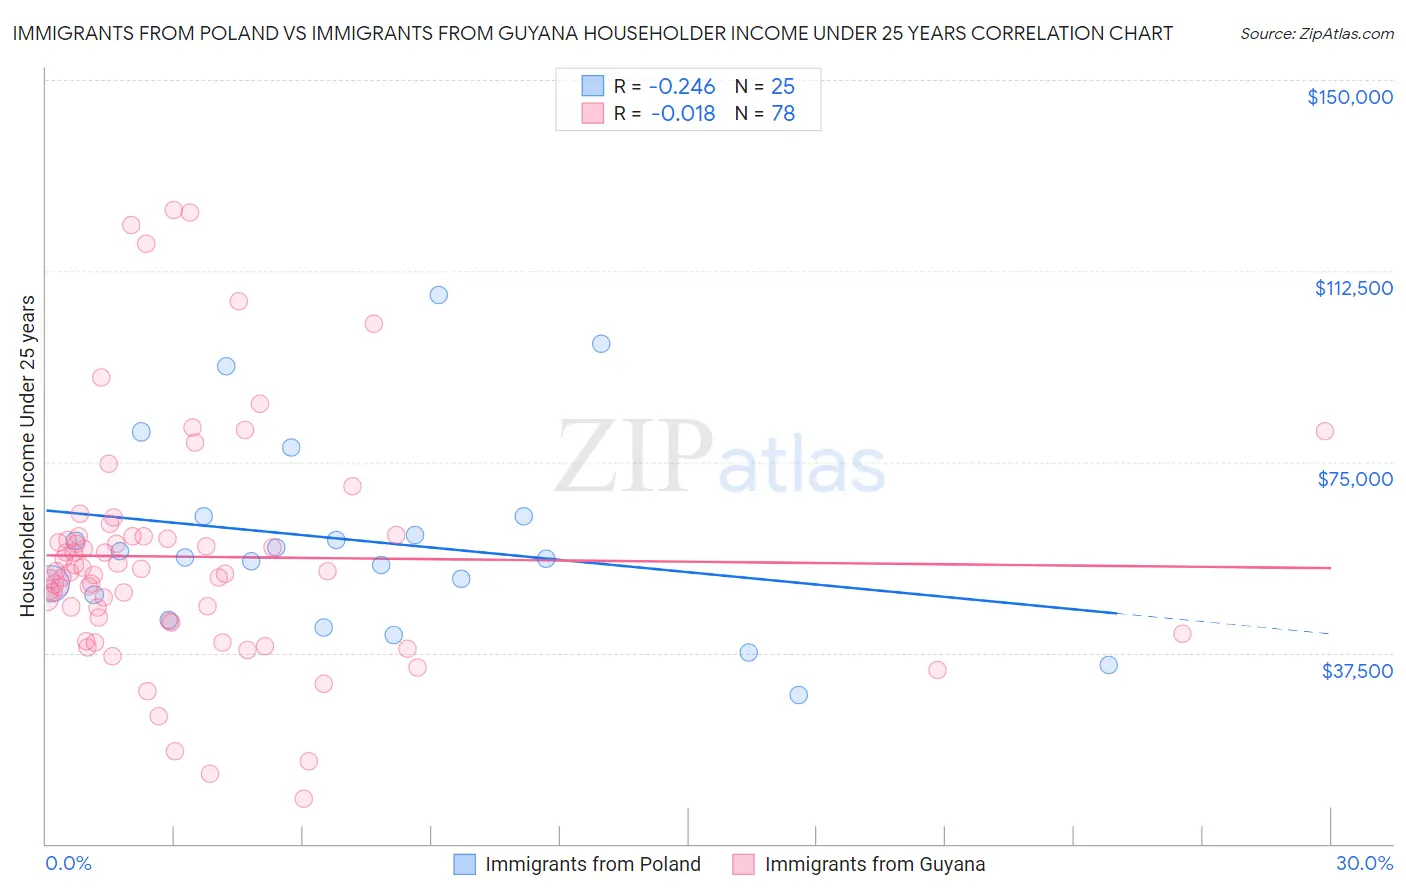
Immigrants from Poland vs Immigrants from Guyana Householder Income Under 25 years Correlation Chart
The statistical analysis conducted on geographies consisting of 255,465,653 people shows a weak negative correlation between the proportion of Immigrants from Poland and household income with householder under the age of 25 in the United States with a correlation coefficient (R) of -0.246 and weighted average of $55,474. Similarly, the statistical analysis conducted on geographies consisting of 159,030,692 people shows no correlation between the proportion of Immigrants from Guyana and household income with householder under the age of 25 in the United States with a correlation coefficient (R) of -0.018 and weighted average of $55,726, a difference of 0.45%.
Householder Income Under 25 years Correlation Summary
| Measurement | Immigrants from Poland | Immigrants from Guyana |
| Minimum | $29,167 | $8,838 |
| Maximum | $107,690 | $124,392 |
| Range | $78,523 | $115,554 |
| Mean | $59,420 | $56,359 |
| Median | $56,166 | $53,366 |
| Interquartile 25% (IQ1) | $46,340 | $43,724 |
| Interquartile 75% (IQ3) | $64,254 | $60,316 |
| Interquartile Range (IQR) | $17,913 | $16,592 |
| Standard Deviation (Sample) | $19,376 | $23,247 |
| Standard Deviation (Population) | $18,984 | $23,098 |
Demographics Similar to Immigrants from Poland and Immigrants from Guyana by Householder Income Under 25 years
In terms of householder income under 25 years, the demographic groups most similar to Immigrants from Poland are Sri Lankan ($55,470, a difference of 0.010%), Immigrants from Ukraine ($55,447, a difference of 0.050%), Immigrants from Indonesia ($55,521, a difference of 0.080%), Immigrants from Romania ($55,522, a difference of 0.090%), and Salvadoran ($55,412, a difference of 0.11%). Similarly, the demographic groups most similar to Immigrants from Guyana are Immigrants from Greece ($55,727, a difference of 0.0%), Immigrants from Korea ($55,716, a difference of 0.020%), Immigrants from South Eastern Asia ($55,714, a difference of 0.020%), Immigrants from Belarus ($55,743, a difference of 0.030%), and Paraguayan ($55,614, a difference of 0.20%).
| Demographics | Rating | Rank | Householder Income Under 25 years |
| Immigrants | Russia | 100.0 /100 | #37 | Exceptional $55,891 |
| Immigrants | Iran | 100.0 /100 | #38 | Exceptional $55,880 |
| Immigrants | Belarus | 100.0 /100 | #39 | Exceptional $55,743 |
| Immigrants | Greece | 100.0 /100 | #40 | Exceptional $55,727 |
| Immigrants | Guyana | 100.0 /100 | #41 | Exceptional $55,726 |
| Immigrants | Korea | 100.0 /100 | #42 | Exceptional $55,716 |
| Immigrants | South Eastern Asia | 100.0 /100 | #43 | Exceptional $55,714 |
| Paraguayans | 100.0 /100 | #44 | Exceptional $55,614 |
| Spanish American Indians | 100.0 /100 | #45 | Exceptional $55,573 |
| Immigrants | Eastern Europe | 100.0 /100 | #46 | Exceptional $55,572 |
| Cambodians | 100.0 /100 | #47 | Exceptional $55,571 |
| Immigrants | Vietnam | 100.0 /100 | #48 | Exceptional $55,562 |
| Iranians | 100.0 /100 | #49 | Exceptional $55,548 |
| Puget Sound Salish | 100.0 /100 | #50 | Exceptional $55,543 |
| Immigrants | Romania | 100.0 /100 | #51 | Exceptional $55,522 |
| Immigrants | Indonesia | 100.0 /100 | #52 | Exceptional $55,521 |
| Immigrants | Poland | 100.0 /100 | #53 | Exceptional $55,474 |
| Sri Lankans | 100.0 /100 | #54 | Exceptional $55,470 |
| Immigrants | Ukraine | 100.0 /100 | #55 | Exceptional $55,447 |
| Salvadorans | 100.0 /100 | #56 | Exceptional $55,412 |
| Soviet Union | 100.0 /100 | #57 | Exceptional $55,340 |