Immigrants from Philippines vs Immigrants from Somalia Unemployment
COMPARE
Immigrants from Philippines
Immigrants from Somalia
Unemployment
Unemployment Comparison
Immigrants from Philippines
Immigrants from Somalia
5.4%
UNEMPLOYMENT
10.4/ 100
METRIC RATING
221st/ 347
METRIC RANK
5.3%
UNEMPLOYMENT
33.8/ 100
METRIC RATING
193rd/ 347
METRIC RANK
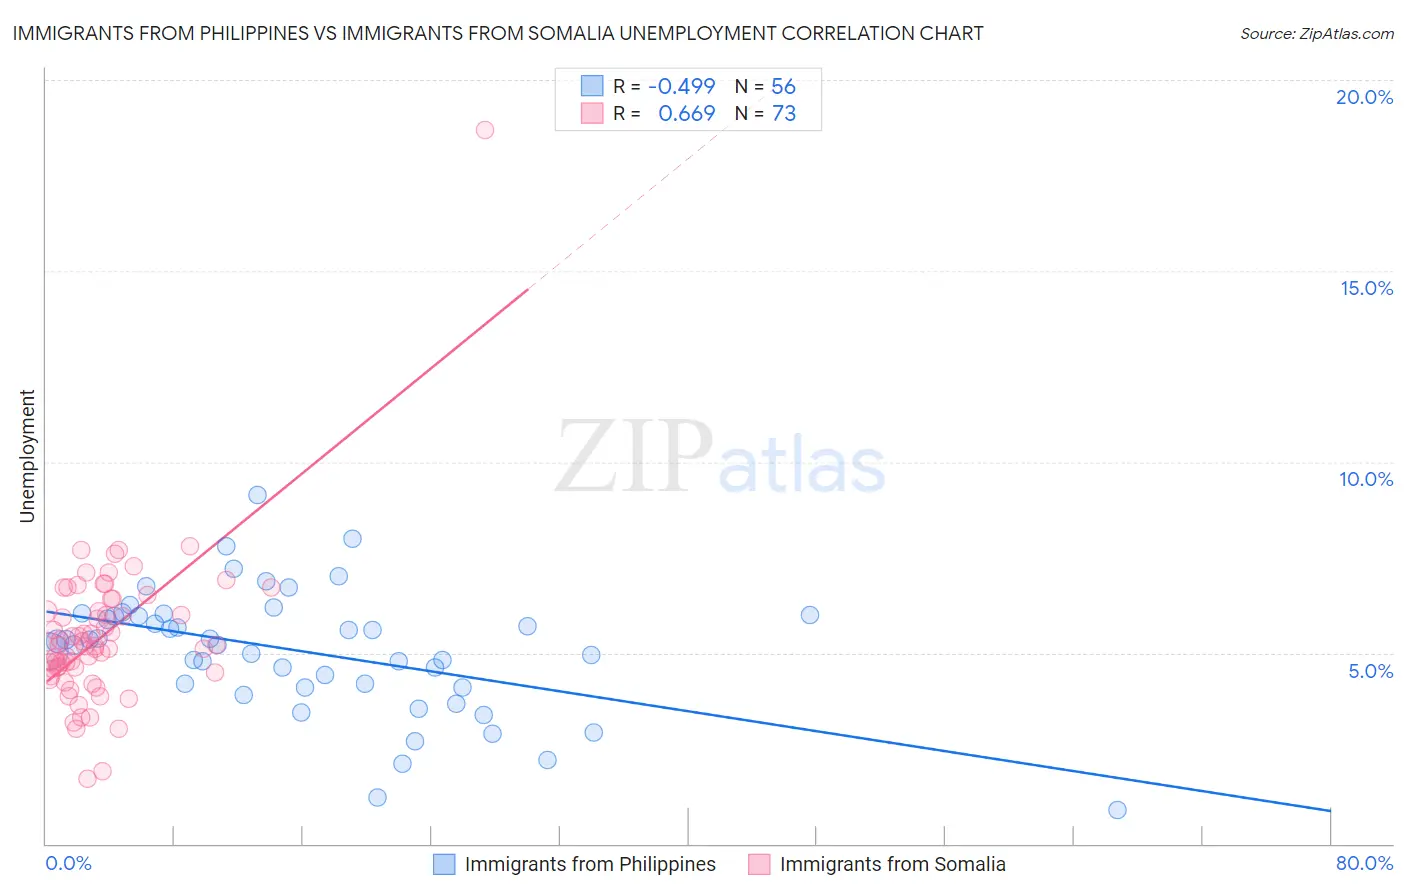
Immigrants from Philippines vs Immigrants from Somalia Unemployment Correlation Chart
The statistical analysis conducted on geographies consisting of 470,568,280 people shows a moderate negative correlation between the proportion of Immigrants from Philippines and unemployment in the United States with a correlation coefficient (R) of -0.499 and weighted average of 5.4%. Similarly, the statistical analysis conducted on geographies consisting of 92,091,323 people shows a significant positive correlation between the proportion of Immigrants from Somalia and unemployment in the United States with a correlation coefficient (R) of 0.669 and weighted average of 5.3%, a difference of 2.2%.
Unemployment Correlation Summary
| Measurement | Immigrants from Philippines | Immigrants from Somalia |
| Minimum | 0.90% | 1.7% |
| Maximum | 9.1% | 18.7% |
| Range | 8.2% | 17.0% |
| Mean | 5.0% | 5.4% |
| Median | 5.3% | 5.2% |
| Interquartile 25% (IQ1) | 4.1% | 4.5% |
| Interquartile 75% (IQ3) | 6.0% | 6.2% |
| Interquartile Range (IQR) | 1.8% | 1.7% |
| Standard Deviation (Sample) | 1.6% | 2.1% |
| Standard Deviation (Population) | 1.6% | 2.0% |
Similar Demographics by Unemployment
Demographics Similar to Immigrants from Philippines by Unemployment
In terms of unemployment, the demographic groups most similar to Immigrants from Philippines are Iroquois (5.4%, a difference of 0.020%), Soviet Union (5.4%, a difference of 0.040%), Bangladeshi (5.4%, a difference of 0.12%), Seminole (5.4%, a difference of 0.21%), and Israeli (5.4%, a difference of 0.28%).
| Demographics | Rating | Rank | Unemployment |
| Immigrants | Costa Rica | 15.2 /100 | #214 | Poor 5.4% |
| Delaware | 14.7 /100 | #215 | Poor 5.4% |
| Immigrants | South America | 13.5 /100 | #216 | Poor 5.4% |
| Immigrants | Albania | 13.5 /100 | #217 | Poor 5.4% |
| Choctaw | 12.7 /100 | #218 | Poor 5.4% |
| Bangladeshis | 11.2 /100 | #219 | Poor 5.4% |
| Soviet Union | 10.6 /100 | #220 | Poor 5.4% |
| Immigrants | Philippines | 10.4 /100 | #221 | Poor 5.4% |
| Iroquois | 10.3 /100 | #222 | Poor 5.4% |
| Seminole | 9.2 /100 | #223 | Tragic 5.4% |
| Israelis | 8.8 /100 | #224 | Tragic 5.4% |
| South American Indians | 7.8 /100 | #225 | Tragic 5.5% |
| Samoans | 7.1 /100 | #226 | Tragic 5.5% |
| Immigrants | Lebanon | 7.0 /100 | #227 | Tragic 5.5% |
| Guamanians/Chamorros | 6.3 /100 | #228 | Tragic 5.5% |
Demographics Similar to Immigrants from Somalia by Unemployment
In terms of unemployment, the demographic groups most similar to Immigrants from Somalia are Somali (5.3%, a difference of 0.010%), South American (5.3%, a difference of 0.010%), Arab (5.3%, a difference of 0.10%), Immigrants from Belarus (5.3%, a difference of 0.12%), and Immigrants from Laos (5.3%, a difference of 0.20%).
| Demographics | Rating | Rank | Unemployment |
| Immigrants | Uganda | 37.8 /100 | #186 | Fair 5.3% |
| Costa Ricans | 37.4 /100 | #187 | Fair 5.3% |
| Alsatians | 37.0 /100 | #188 | Fair 5.3% |
| Immigrants | Belarus | 35.6 /100 | #189 | Fair 5.3% |
| Arabs | 35.3 /100 | #190 | Fair 5.3% |
| Somalis | 34.0 /100 | #191 | Fair 5.3% |
| South Americans | 33.9 /100 | #192 | Fair 5.3% |
| Immigrants | Somalia | 33.8 /100 | #193 | Fair 5.3% |
| Immigrants | Laos | 30.9 /100 | #194 | Fair 5.3% |
| Immigrants | Southern Europe | 30.9 /100 | #195 | Fair 5.3% |
| Peruvians | 29.9 /100 | #196 | Fair 5.3% |
| Immigrants | Uruguay | 29.8 /100 | #197 | Fair 5.3% |
| Immigrants | Israel | 28.6 /100 | #198 | Fair 5.3% |
| Immigrants | Afghanistan | 28.6 /100 | #199 | Fair 5.3% |
| Koreans | 27.4 /100 | #200 | Fair 5.3% |