Immigrants from Philippines vs Greek Unemployment
COMPARE
Immigrants from Philippines
Greek
Unemployment
Unemployment Comparison
Immigrants from Philippines
Greeks
5.4%
UNEMPLOYMENT
10.4/ 100
METRIC RATING
221st/ 347
METRIC RANK
4.9%
UNEMPLOYMENT
99.0/ 100
METRIC RATING
58th/ 347
METRIC RANK
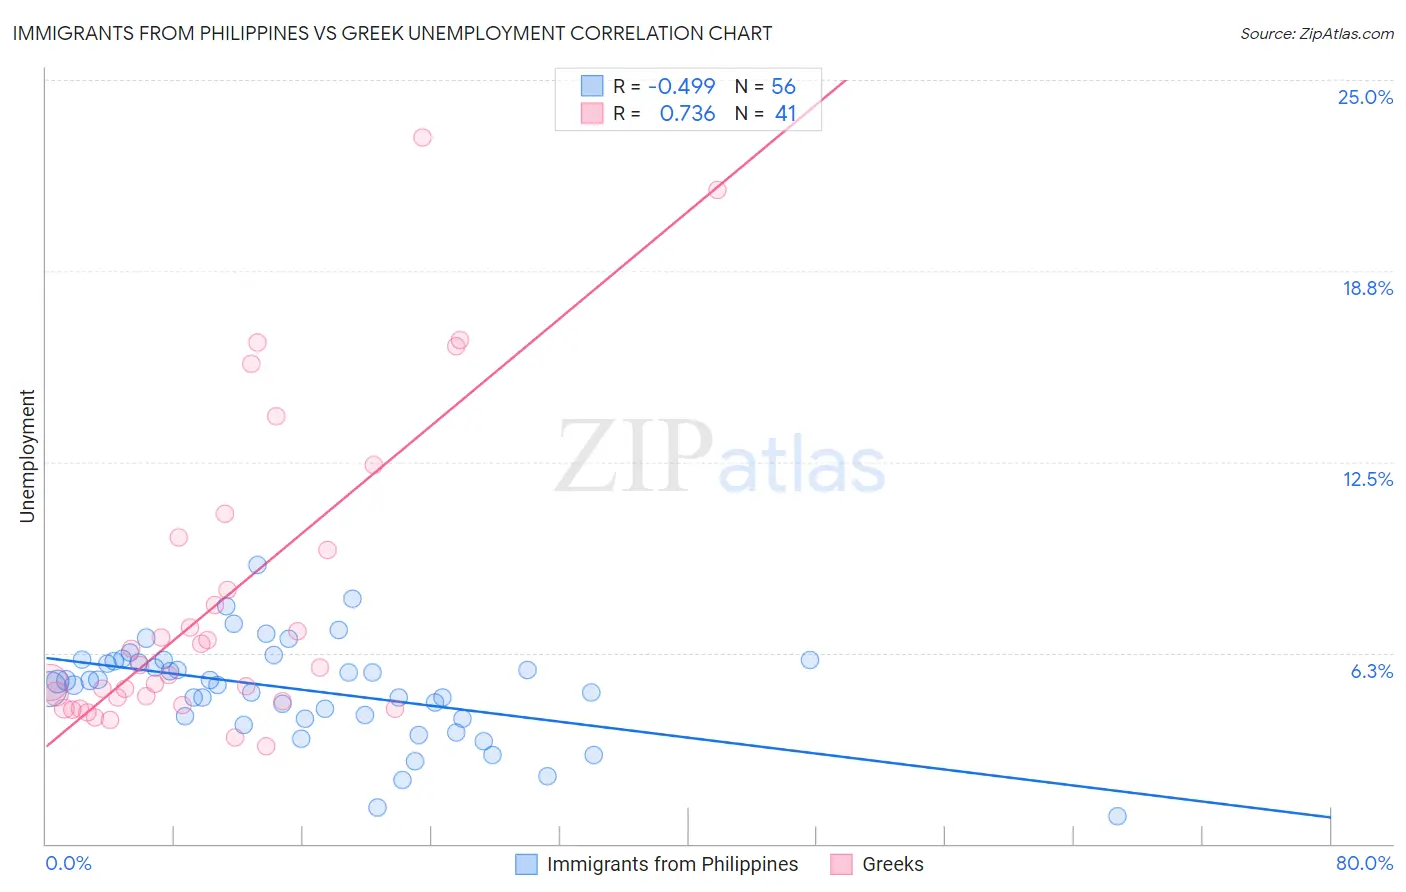
Immigrants from Philippines vs Greek Unemployment Correlation Chart
The statistical analysis conducted on geographies consisting of 470,568,280 people shows a moderate negative correlation between the proportion of Immigrants from Philippines and unemployment in the United States with a correlation coefficient (R) of -0.499 and weighted average of 5.4%. Similarly, the statistical analysis conducted on geographies consisting of 481,787,990 people shows a strong positive correlation between the proportion of Greeks and unemployment in the United States with a correlation coefficient (R) of 0.736 and weighted average of 4.9%, a difference of 11.1%.
Unemployment Correlation Summary
| Measurement | Immigrants from Philippines | Greek |
| Minimum | 0.90% | 3.2% |
| Maximum | 9.1% | 23.1% |
| Range | 8.2% | 19.9% |
| Mean | 5.0% | 8.0% |
| Median | 5.3% | 5.8% |
| Interquartile 25% (IQ1) | 4.1% | 4.6% |
| Interquartile 75% (IQ3) | 6.0% | 9.8% |
| Interquartile Range (IQR) | 1.8% | 5.2% |
| Standard Deviation (Sample) | 1.6% | 5.0% |
| Standard Deviation (Population) | 1.6% | 5.0% |
Similar Demographics by Unemployment
Demographics Similar to Immigrants from Philippines by Unemployment
In terms of unemployment, the demographic groups most similar to Immigrants from Philippines are Iroquois (5.4%, a difference of 0.020%), Soviet Union (5.4%, a difference of 0.040%), Bangladeshi (5.4%, a difference of 0.12%), Seminole (5.4%, a difference of 0.21%), and Israeli (5.4%, a difference of 0.28%).
| Demographics | Rating | Rank | Unemployment |
| Immigrants | Costa Rica | 15.2 /100 | #214 | Poor 5.4% |
| Delaware | 14.7 /100 | #215 | Poor 5.4% |
| Immigrants | South America | 13.5 /100 | #216 | Poor 5.4% |
| Immigrants | Albania | 13.5 /100 | #217 | Poor 5.4% |
| Choctaw | 12.7 /100 | #218 | Poor 5.4% |
| Bangladeshis | 11.2 /100 | #219 | Poor 5.4% |
| Soviet Union | 10.6 /100 | #220 | Poor 5.4% |
| Immigrants | Philippines | 10.4 /100 | #221 | Poor 5.4% |
| Iroquois | 10.3 /100 | #222 | Poor 5.4% |
| Seminole | 9.2 /100 | #223 | Tragic 5.4% |
| Israelis | 8.8 /100 | #224 | Tragic 5.4% |
| South American Indians | 7.8 /100 | #225 | Tragic 5.5% |
| Samoans | 7.1 /100 | #226 | Tragic 5.5% |
| Immigrants | Lebanon | 7.0 /100 | #227 | Tragic 5.5% |
| Guamanians/Chamorros | 6.3 /100 | #228 | Tragic 5.5% |
Demographics Similar to Greeks by Unemployment
In terms of unemployment, the demographic groups most similar to Greeks are Bhutanese (4.9%, a difference of 0.030%), Immigrants from Netherlands (4.9%, a difference of 0.070%), Cambodian (4.9%, a difference of 0.070%), Icelander (4.9%, a difference of 0.080%), and Immigrants from Singapore (4.9%, a difference of 0.10%).
| Demographics | Rating | Rank | Unemployment |
| Immigrants | Belgium | 99.2 /100 | #51 | Exceptional 4.9% |
| Whites/Caucasians | 99.2 /100 | #52 | Exceptional 4.9% |
| Immigrants | Zimbabwe | 99.2 /100 | #53 | Exceptional 4.9% |
| Eastern Europeans | 99.2 /100 | #54 | Exceptional 4.9% |
| Australians | 99.2 /100 | #55 | Exceptional 4.9% |
| Celtics | 99.1 /100 | #56 | Exceptional 4.9% |
| Immigrants | Singapore | 99.1 /100 | #57 | Exceptional 4.9% |
| Greeks | 99.0 /100 | #58 | Exceptional 4.9% |
| Bhutanese | 99.0 /100 | #59 | Exceptional 4.9% |
| Immigrants | Netherlands | 99.0 /100 | #60 | Exceptional 4.9% |
| Cambodians | 99.0 /100 | #61 | Exceptional 4.9% |
| Icelanders | 98.9 /100 | #62 | Exceptional 4.9% |
| Immigrants | Bulgaria | 98.9 /100 | #63 | Exceptional 4.9% |
| Italians | 98.9 /100 | #64 | Exceptional 4.9% |
| Immigrants | Canada | 98.8 /100 | #65 | Exceptional 4.9% |