Immigrants from Philippines vs Native/Alaskan Professional Degree
COMPARE
Immigrants from Philippines
Native/Alaskan
Professional Degree
Professional Degree Comparison
Immigrants from Philippines
Natives/Alaskans
3.9%
PROFESSIONAL DEGREE
4.1/ 100
METRIC RATING
233rd/ 347
METRIC RANK
3.0%
PROFESSIONAL DEGREE
0.0/ 100
METRIC RATING
335th/ 347
METRIC RANK
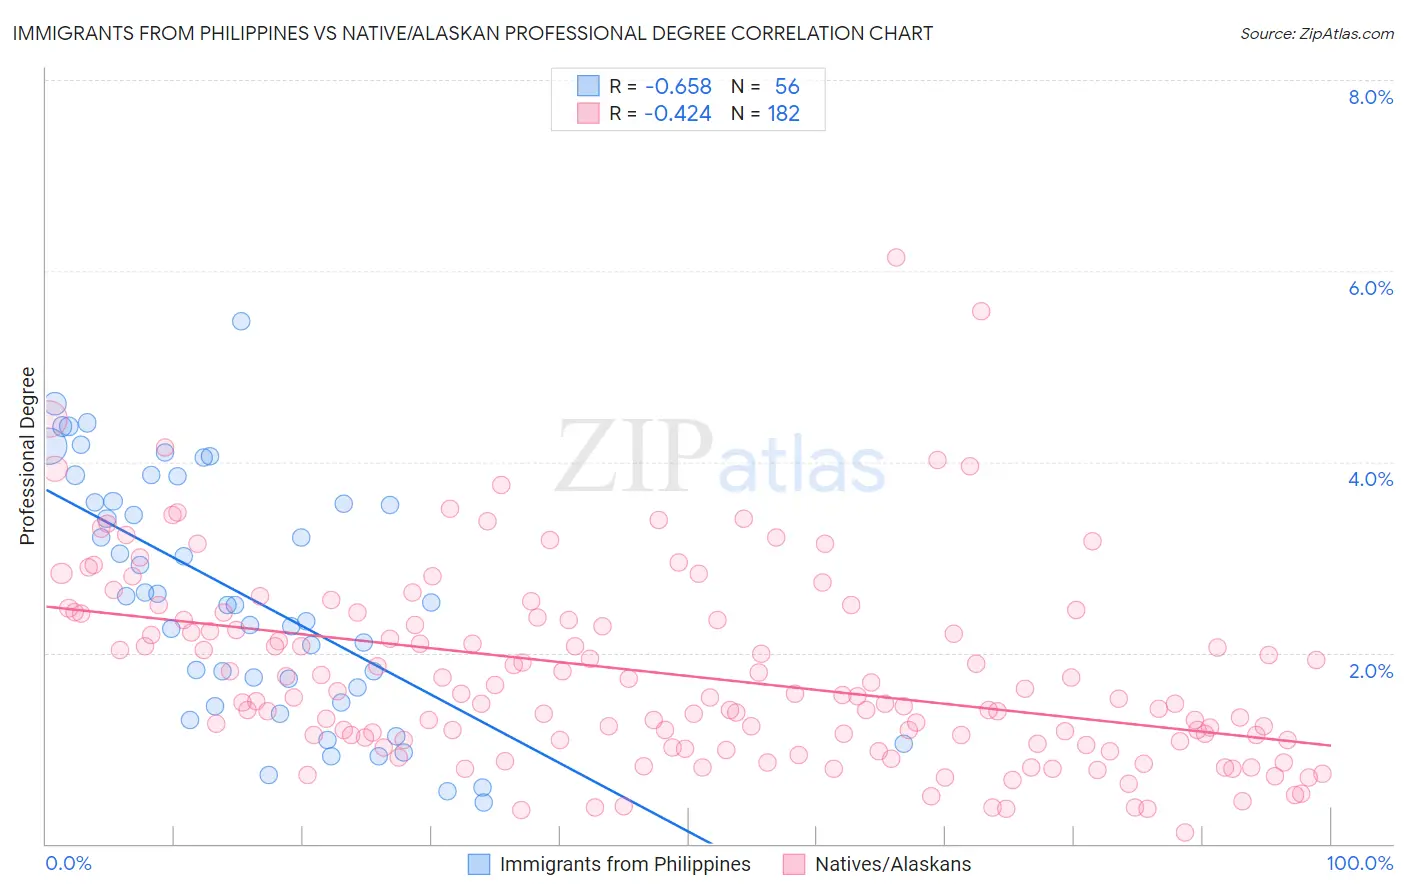
Immigrants from Philippines vs Native/Alaskan Professional Degree Correlation Chart
The statistical analysis conducted on geographies consisting of 469,653,358 people shows a significant negative correlation between the proportion of Immigrants from Philippines and percentage of population with at least professional degree education in the United States with a correlation coefficient (R) of -0.658 and weighted average of 3.9%. Similarly, the statistical analysis conducted on geographies consisting of 508,142,680 people shows a moderate negative correlation between the proportion of Natives/Alaskans and percentage of population with at least professional degree education in the United States with a correlation coefficient (R) of -0.424 and weighted average of 3.0%, a difference of 32.0%.
Professional Degree Correlation Summary
| Measurement | Immigrants from Philippines | Native/Alaskan |
| Minimum | 0.44% | 0.12% |
| Maximum | 5.5% | 6.1% |
| Range | 5.0% | 6.0% |
| Mean | 2.6% | 1.8% |
| Median | 2.5% | 1.5% |
| Interquartile 25% (IQ1) | 1.6% | 1.1% |
| Interquartile 75% (IQ3) | 3.6% | 2.3% |
| Interquartile Range (IQR) | 2.0% | 1.3% |
| Standard Deviation (Sample) | 1.3% | 1.0% |
| Standard Deviation (Population) | 1.2% | 1.0% |
Similar Demographics by Professional Degree
Demographics Similar to Immigrants from Philippines by Professional Degree
In terms of professional degree, the demographic groups most similar to Immigrants from Philippines are Nonimmigrants (3.9%, a difference of 0.050%), Immigrants from Barbados (3.9%, a difference of 0.050%), Cree (3.9%, a difference of 0.26%), Spanish American (3.9%, a difference of 0.28%), and Immigrants from Trinidad and Tobago (3.9%, a difference of 0.34%).
| Demographics | Rating | Rank | Professional Degree |
| German Russians | 6.1 /100 | #226 | Tragic 4.0% |
| Cubans | 5.9 /100 | #227 | Tragic 4.0% |
| Immigrants | West Indies | 5.6 /100 | #228 | Tragic 4.0% |
| Immigrants | Burma/Myanmar | 5.4 /100 | #229 | Tragic 3.9% |
| Nicaraguans | 5.1 /100 | #230 | Tragic 3.9% |
| Ecuadorians | 4.6 /100 | #231 | Tragic 3.9% |
| Cree | 4.3 /100 | #232 | Tragic 3.9% |
| Immigrants | Philippines | 4.1 /100 | #233 | Tragic 3.9% |
| Immigrants | Nonimmigrants | 4.0 /100 | #234 | Tragic 3.9% |
| Immigrants | Barbados | 4.0 /100 | #235 | Tragic 3.9% |
| Spanish Americans | 3.8 /100 | #236 | Tragic 3.9% |
| Immigrants | Trinidad and Tobago | 3.8 /100 | #237 | Tragic 3.9% |
| Colville | 2.6 /100 | #238 | Tragic 3.8% |
| British West Indians | 2.4 /100 | #239 | Tragic 3.8% |
| Immigrants | Ecuador | 2.3 /100 | #240 | Tragic 3.8% |
Demographics Similar to Natives/Alaskans by Professional Degree
In terms of professional degree, the demographic groups most similar to Natives/Alaskans are Pennsylvania German (3.0%, a difference of 0.56%), Fijian (2.9%, a difference of 1.0%), Arapaho (2.9%, a difference of 2.8%), Navajo (2.9%, a difference of 2.9%), and Immigrants from Central America (2.9%, a difference of 3.0%).
| Demographics | Rating | Rank | Professional Degree |
| Creek | 0.0 /100 | #328 | Tragic 3.1% |
| Bangladeshis | 0.0 /100 | #329 | Tragic 3.1% |
| Immigrants | Cabo Verde | 0.0 /100 | #330 | Tragic 3.1% |
| Kiowa | 0.0 /100 | #331 | Tragic 3.1% |
| Yakama | 0.0 /100 | #332 | Tragic 3.1% |
| Puget Sound Salish | 0.0 /100 | #333 | Tragic 3.1% |
| Pennsylvania Germans | 0.0 /100 | #334 | Tragic 3.0% |
| Natives/Alaskans | 0.0 /100 | #335 | Tragic 3.0% |
| Fijians | 0.0 /100 | #336 | Tragic 2.9% |
| Arapaho | 0.0 /100 | #337 | Tragic 2.9% |
| Navajo | 0.0 /100 | #338 | Tragic 2.9% |
| Immigrants | Central America | 0.0 /100 | #339 | Tragic 2.9% |
| Yup'ik | 0.0 /100 | #340 | Tragic 2.9% |
| Tohono O'odham | 0.0 /100 | #341 | Tragic 2.8% |
| Immigrants | Azores | 0.0 /100 | #342 | Tragic 2.8% |