Immigrants from Philippines vs Pueblo Unemployment Among Women with Children Under 6 years
COMPARE
Immigrants from Philippines
Pueblo
Unemployment Among Women with Children Under 6 years
Unemployment Among Women with Children Under 6 years Comparison
Immigrants from Philippines
Pueblo
7.5%
UNEMPLOYMENT AMONG WOMEN WITH CHILDREN UNDER 6 YEARS
71.3/ 100
METRIC RATING
159th/ 347
METRIC RANK
9.1%
UNEMPLOYMENT AMONG WOMEN WITH CHILDREN UNDER 6 YEARS
0.0/ 100
METRIC RATING
306th/ 347
METRIC RANK
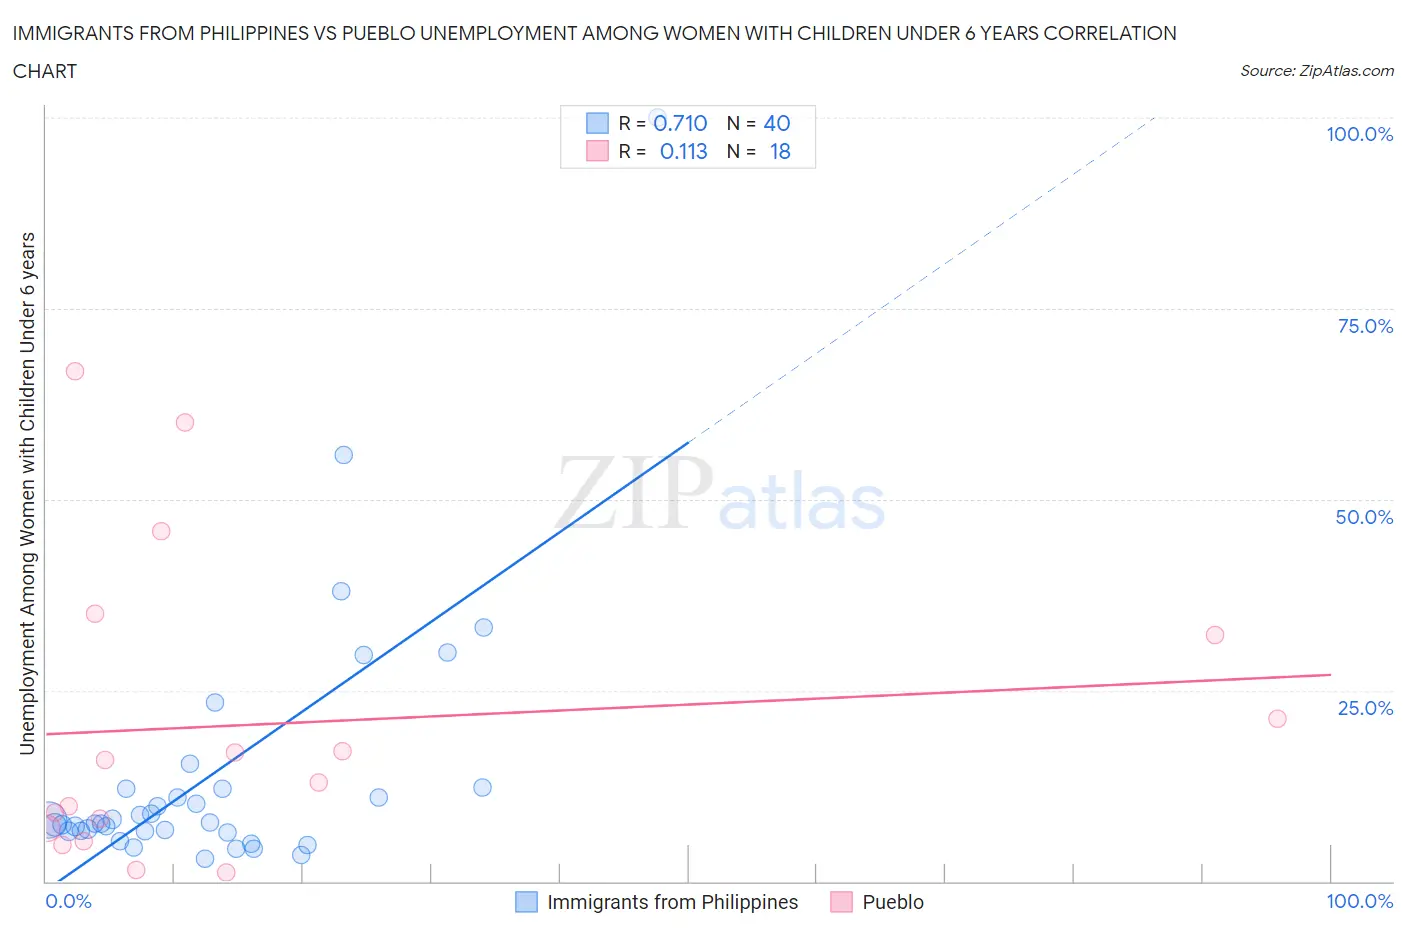
Immigrants from Philippines vs Pueblo Unemployment Among Women with Children Under 6 years Correlation Chart
The statistical analysis conducted on geographies consisting of 343,754,489 people shows a strong positive correlation between the proportion of Immigrants from Philippines and unemployment rate among women with children under the age of 6 in the United States with a correlation coefficient (R) of 0.710 and weighted average of 7.5%. Similarly, the statistical analysis conducted on geographies consisting of 107,371,910 people shows a poor positive correlation between the proportion of Pueblo and unemployment rate among women with children under the age of 6 in the United States with a correlation coefficient (R) of 0.113 and weighted average of 9.1%, a difference of 21.0%.
Unemployment Among Women with Children Under 6 years Correlation Summary
| Measurement | Immigrants from Philippines | Pueblo |
| Minimum | 3.0% | 1.2% |
| Maximum | 100.0% | 66.7% |
| Range | 97.0% | 65.5% |
| Mean | 14.1% | 20.6% |
| Median | 7.6% | 14.4% |
| Interquartile 25% (IQ1) | 6.5% | 7.0% |
| Interquartile 75% (IQ3) | 12.1% | 32.3% |
| Interquartile Range (IQR) | 5.5% | 25.3% |
| Standard Deviation (Sample) | 17.7% | 19.7% |
| Standard Deviation (Population) | 17.5% | 19.1% |
Similar Demographics by Unemployment Among Women with Children Under 6 years
Demographics Similar to Immigrants from Philippines by Unemployment Among Women with Children Under 6 years
In terms of unemployment among women with children under 6 years, the demographic groups most similar to Immigrants from Philippines are Bolivian (7.5%, a difference of 0.040%), Croatian (7.5%, a difference of 0.050%), Peruvian (7.5%, a difference of 0.080%), Immigrants from Western Asia (7.5%, a difference of 0.080%), and Immigrants from Southern Europe (7.5%, a difference of 0.17%).
| Demographics | Rating | Rank | Unemployment Among Women with Children Under 6 years |
| Bangladeshis | 74.8 /100 | #152 | Good 7.5% |
| Uruguayans | 74.7 /100 | #153 | Good 7.5% |
| Northern Europeans | 74.3 /100 | #154 | Good 7.5% |
| South Americans | 74.1 /100 | #155 | Good 7.5% |
| Immigrants | Southern Europe | 73.2 /100 | #156 | Good 7.5% |
| Peruvians | 72.3 /100 | #157 | Good 7.5% |
| Croatians | 71.9 /100 | #158 | Good 7.5% |
| Immigrants | Philippines | 71.3 /100 | #159 | Good 7.5% |
| Bolivians | 70.8 /100 | #160 | Good 7.5% |
| Immigrants | Western Asia | 70.2 /100 | #161 | Good 7.5% |
| Immigrants | Lithuania | 68.8 /100 | #162 | Good 7.5% |
| British | 66.3 /100 | #163 | Good 7.6% |
| Ugandans | 65.8 /100 | #164 | Good 7.6% |
| Immigrants | South America | 65.6 /100 | #165 | Good 7.6% |
| Belgians | 63.5 /100 | #166 | Good 7.6% |
Demographics Similar to Pueblo by Unemployment Among Women with Children Under 6 years
In terms of unemployment among women with children under 6 years, the demographic groups most similar to Pueblo are Dominican (9.1%, a difference of 0.12%), Alaskan Athabascan (9.1%, a difference of 0.17%), Immigrants from Micronesia (9.1%, a difference of 0.18%), Immigrants from Mexico (9.1%, a difference of 0.58%), and African (9.2%, a difference of 0.58%).
| Demographics | Rating | Rank | Unemployment Among Women with Children Under 6 years |
| Immigrants | Jamaica | 0.0 /100 | #299 | Tragic 8.9% |
| Creek | 0.0 /100 | #300 | Tragic 8.9% |
| Chickasaw | 0.0 /100 | #301 | Tragic 9.0% |
| Hispanics or Latinos | 0.0 /100 | #302 | Tragic 9.0% |
| Immigrants | West Indies | 0.0 /100 | #303 | Tragic 9.0% |
| Immigrants | Mexico | 0.0 /100 | #304 | Tragic 9.1% |
| Alaskan Athabascans | 0.0 /100 | #305 | Tragic 9.1% |
| Pueblo | 0.0 /100 | #306 | Tragic 9.1% |
| Dominicans | 0.0 /100 | #307 | Tragic 9.1% |
| Immigrants | Micronesia | 0.0 /100 | #308 | Tragic 9.1% |
| Africans | 0.0 /100 | #309 | Tragic 9.2% |
| Cajuns | 0.0 /100 | #310 | Tragic 9.2% |
| French American Indians | 0.0 /100 | #311 | Tragic 9.2% |
| Immigrants | Azores | 0.0 /100 | #312 | Tragic 9.2% |
| Americans | 0.0 /100 | #313 | Tragic 9.3% |