Immigrants from Oceania vs Blackfeet Male Unemployment
COMPARE
Immigrants from Oceania
Blackfeet
Male Unemployment
Male Unemployment Comparison
Immigrants from Oceania
Blackfeet
5.3%
MALE UNEMPLOYMENT
40.8/ 100
METRIC RATING
179th/ 347
METRIC RANK
6.0%
MALE UNEMPLOYMENT
0.0/ 100
METRIC RATING
271st/ 347
METRIC RANK
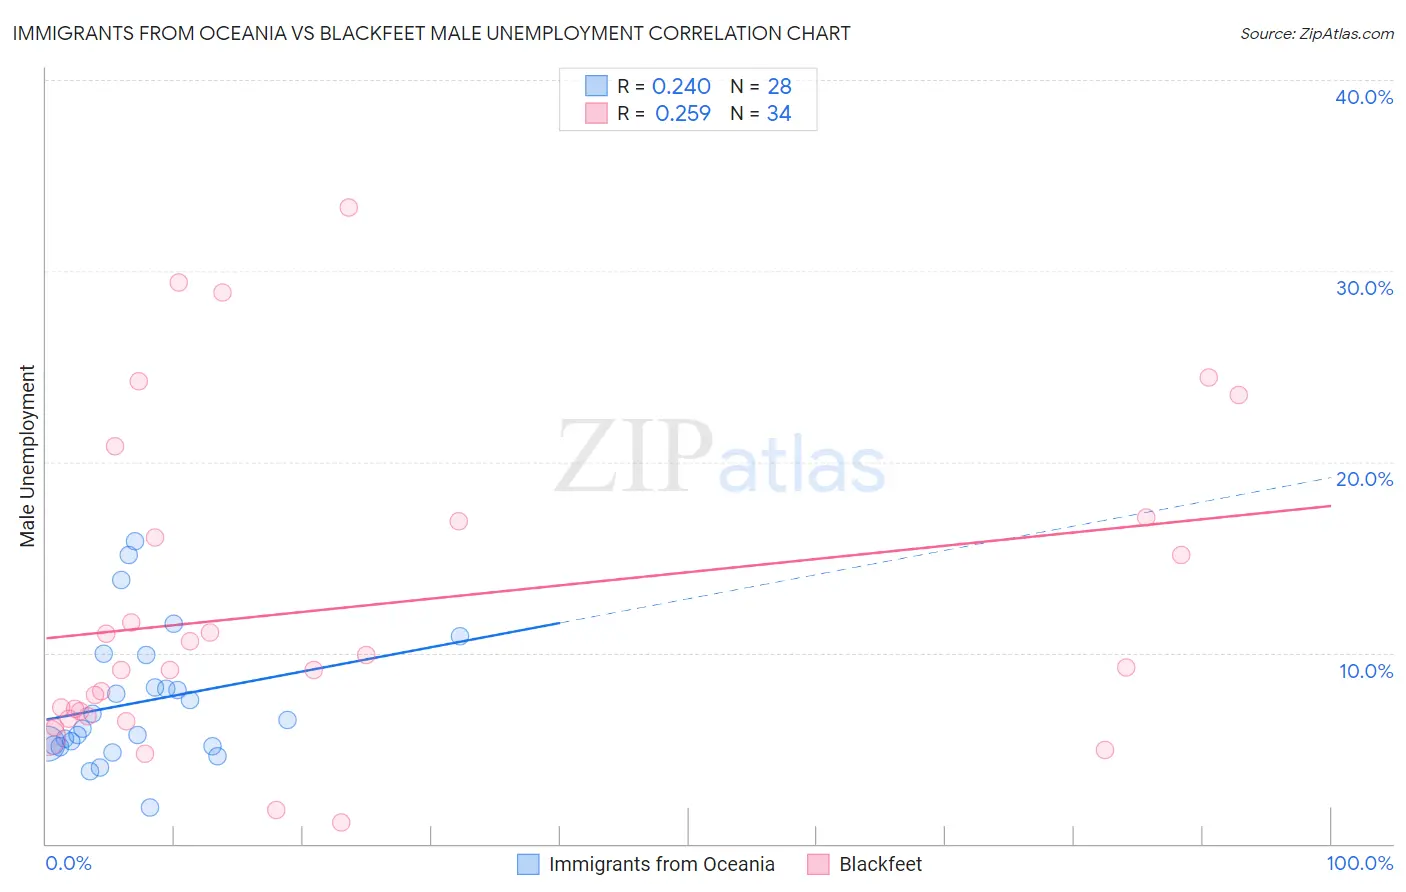
Immigrants from Oceania vs Blackfeet Male Unemployment Correlation Chart
The statistical analysis conducted on geographies consisting of 304,471,992 people shows a weak positive correlation between the proportion of Immigrants from Oceania and unemployment rate among males in the United States with a correlation coefficient (R) of 0.240 and weighted average of 5.3%. Similarly, the statistical analysis conducted on geographies consisting of 308,278,150 people shows a weak positive correlation between the proportion of Blackfeet and unemployment rate among males in the United States with a correlation coefficient (R) of 0.259 and weighted average of 6.0%, a difference of 12.5%.
Male Unemployment Correlation Summary
| Measurement | Immigrants from Oceania | Blackfeet |
| Minimum | 1.9% | 1.1% |
| Maximum | 15.9% | 33.3% |
| Range | 13.9% | 32.2% |
| Mean | 7.4% | 12.4% |
| Median | 6.3% | 9.2% |
| Interquartile 25% (IQ1) | 5.1% | 6.7% |
| Interquartile 75% (IQ3) | 9.0% | 16.9% |
| Interquartile Range (IQR) | 3.9% | 10.2% |
| Standard Deviation (Sample) | 3.5% | 8.3% |
| Standard Deviation (Population) | 3.4% | 8.2% |
Similar Demographics by Male Unemployment
Demographics Similar to Immigrants from Oceania by Male Unemployment
In terms of male unemployment, the demographic groups most similar to Immigrants from Oceania are Malaysian (5.3%, a difference of 0.070%), Osage (5.3%, a difference of 0.10%), Immigrants from Afghanistan (5.3%, a difference of 0.18%), Potawatomi (5.3%, a difference of 0.18%), and Taiwanese (5.3%, a difference of 0.20%).
| Demographics | Rating | Rank | Male Unemployment |
| Immigrants | Kazakhstan | 50.8 /100 | #172 | Average 5.3% |
| Immigrants | Russia | 50.7 /100 | #173 | Average 5.3% |
| Immigrants | Iran | 50.0 /100 | #174 | Average 5.3% |
| Immigrants | Iraq | 48.1 /100 | #175 | Average 5.3% |
| Immigrants | Poland | 46.0 /100 | #176 | Average 5.3% |
| Immigrants | Peru | 44.6 /100 | #177 | Average 5.3% |
| Osage | 42.5 /100 | #178 | Average 5.3% |
| Immigrants | Oceania | 40.8 /100 | #179 | Average 5.3% |
| Malaysians | 39.6 /100 | #180 | Fair 5.3% |
| Immigrants | Afghanistan | 37.9 /100 | #181 | Fair 5.3% |
| Potawatomi | 37.8 /100 | #182 | Fair 5.3% |
| Taiwanese | 37.6 /100 | #183 | Fair 5.3% |
| Spaniards | 35.1 /100 | #184 | Fair 5.3% |
| Koreans | 34.9 /100 | #185 | Fair 5.3% |
| Iraqis | 31.6 /100 | #186 | Fair 5.4% |
Demographics Similar to Blackfeet by Male Unemployment
In terms of male unemployment, the demographic groups most similar to Blackfeet are Immigrants from Uzbekistan (6.0%, a difference of 0.23%), Armenian (6.0%, a difference of 0.24%), Immigrants from Sierra Leone (6.0%, a difference of 0.41%), Subsaharan African (6.0%, a difference of 0.50%), and Menominee (6.0%, a difference of 0.57%).
| Demographics | Rating | Rank | Male Unemployment |
| Immigrants | Mexico | 0.0 /100 | #264 | Tragic 5.9% |
| French American Indians | 0.0 /100 | #265 | Tragic 5.9% |
| Bahamians | 0.0 /100 | #266 | Tragic 5.9% |
| Nigerians | 0.0 /100 | #267 | Tragic 5.9% |
| Bermudans | 0.0 /100 | #268 | Tragic 5.9% |
| Immigrants | Nigeria | 0.0 /100 | #269 | Tragic 6.0% |
| Sub-Saharan Africans | 0.0 /100 | #270 | Tragic 6.0% |
| Blackfeet | 0.0 /100 | #271 | Tragic 6.0% |
| Immigrants | Uzbekistan | 0.0 /100 | #272 | Tragic 6.0% |
| Armenians | 0.0 /100 | #273 | Tragic 6.0% |
| Immigrants | Sierra Leone | 0.0 /100 | #274 | Tragic 6.0% |
| Menominee | 0.0 /100 | #275 | Tragic 6.0% |
| Tlingit-Haida | 0.0 /100 | #276 | Tragic 6.0% |
| Immigrants | Liberia | 0.0 /100 | #277 | Tragic 6.1% |
| Immigrants | Fiji | 0.0 /100 | #278 | Tragic 6.1% |