Immigrants from Oceania vs English Male Unemployment
COMPARE
Immigrants from Oceania
English
Male Unemployment
Male Unemployment Comparison
Immigrants from Oceania
English
5.3%
MALE UNEMPLOYMENT
40.8/ 100
METRIC RATING
179th/ 347
METRIC RANK
4.8%
MALE UNEMPLOYMENT
99.9/ 100
METRIC RATING
18th/ 347
METRIC RANK
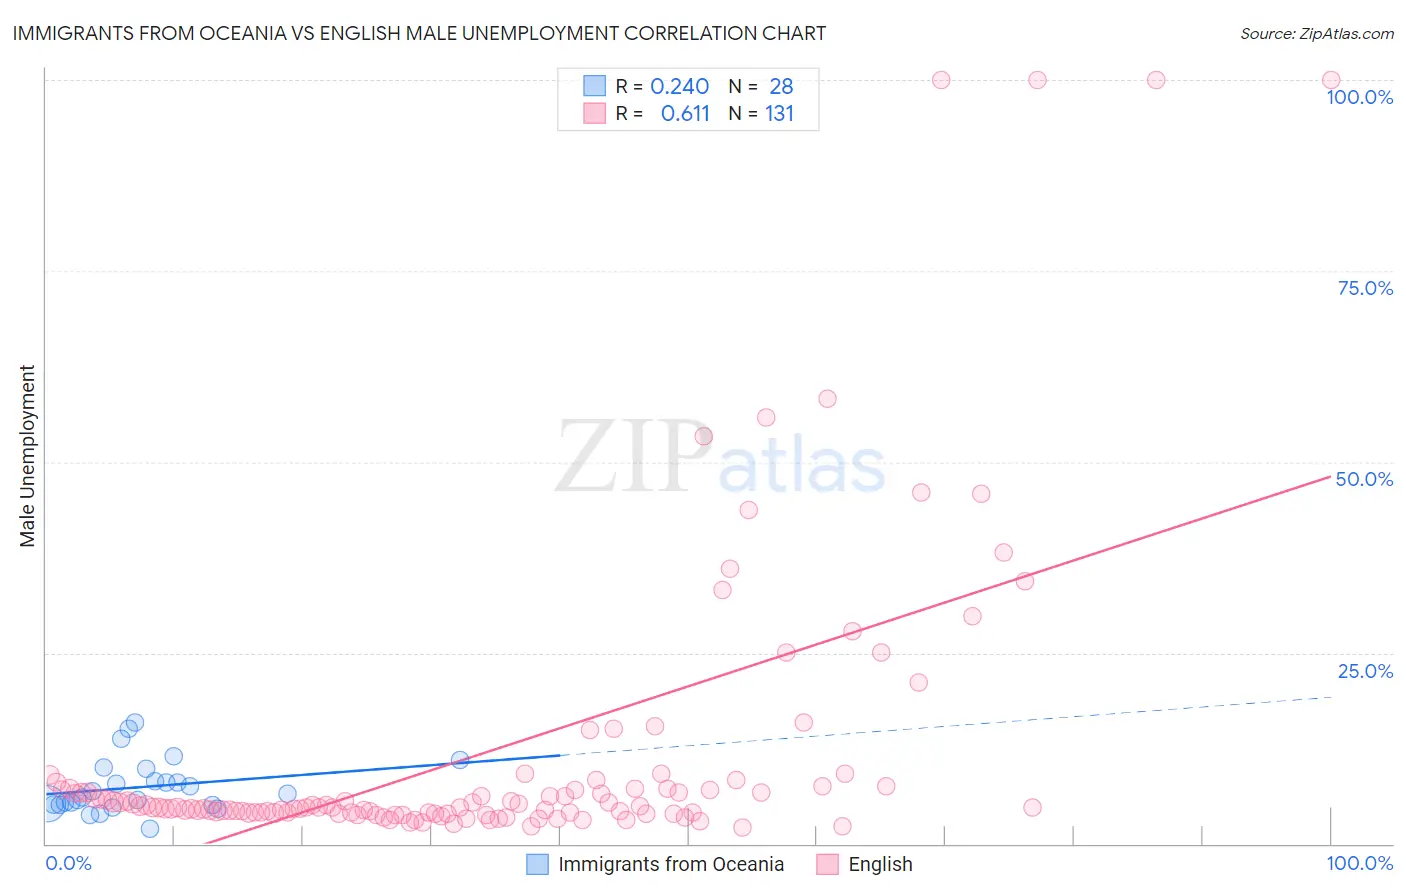
Immigrants from Oceania vs English Male Unemployment Correlation Chart
The statistical analysis conducted on geographies consisting of 304,471,992 people shows a weak positive correlation between the proportion of Immigrants from Oceania and unemployment rate among males in the United States with a correlation coefficient (R) of 0.240 and weighted average of 5.3%. Similarly, the statistical analysis conducted on geographies consisting of 566,278,117 people shows a significant positive correlation between the proportion of English and unemployment rate among males in the United States with a correlation coefficient (R) of 0.611 and weighted average of 4.8%, a difference of 11.9%.
Male Unemployment Correlation Summary
| Measurement | Immigrants from Oceania | English |
| Minimum | 1.9% | 2.2% |
| Maximum | 15.9% | 100.0% |
| Range | 13.9% | 97.8% |
| Mean | 7.4% | 12.0% |
| Median | 6.3% | 4.8% |
| Interquartile 25% (IQ1) | 5.1% | 4.0% |
| Interquartile 75% (IQ3) | 9.0% | 7.3% |
| Interquartile Range (IQR) | 3.9% | 3.2% |
| Standard Deviation (Sample) | 3.5% | 19.4% |
| Standard Deviation (Population) | 3.4% | 19.3% |
Similar Demographics by Male Unemployment
Demographics Similar to Immigrants from Oceania by Male Unemployment
In terms of male unemployment, the demographic groups most similar to Immigrants from Oceania are Malaysian (5.3%, a difference of 0.070%), Osage (5.3%, a difference of 0.10%), Immigrants from Afghanistan (5.3%, a difference of 0.18%), Potawatomi (5.3%, a difference of 0.18%), and Taiwanese (5.3%, a difference of 0.20%).
| Demographics | Rating | Rank | Male Unemployment |
| Immigrants | Kazakhstan | 50.8 /100 | #172 | Average 5.3% |
| Immigrants | Russia | 50.7 /100 | #173 | Average 5.3% |
| Immigrants | Iran | 50.0 /100 | #174 | Average 5.3% |
| Immigrants | Iraq | 48.1 /100 | #175 | Average 5.3% |
| Immigrants | Poland | 46.0 /100 | #176 | Average 5.3% |
| Immigrants | Peru | 44.6 /100 | #177 | Average 5.3% |
| Osage | 42.5 /100 | #178 | Average 5.3% |
| Immigrants | Oceania | 40.8 /100 | #179 | Average 5.3% |
| Malaysians | 39.6 /100 | #180 | Fair 5.3% |
| Immigrants | Afghanistan | 37.9 /100 | #181 | Fair 5.3% |
| Potawatomi | 37.8 /100 | #182 | Fair 5.3% |
| Taiwanese | 37.6 /100 | #183 | Fair 5.3% |
| Spaniards | 35.1 /100 | #184 | Fair 5.3% |
| Koreans | 34.9 /100 | #185 | Fair 5.3% |
| Iraqis | 31.6 /100 | #186 | Fair 5.4% |
Demographics Similar to English by Male Unemployment
In terms of male unemployment, the demographic groups most similar to English are European (4.8%, a difference of 0.030%), Pennsylvania German (4.8%, a difference of 0.080%), Immigrants from Taiwan (4.8%, a difference of 0.24%), Carpatho Rusyn (4.8%, a difference of 0.26%), and Filipino (4.7%, a difference of 0.30%).
| Demographics | Rating | Rank | Male Unemployment |
| Swedes | 100.0 /100 | #11 | Exceptional 4.6% |
| Immigrants | Bolivia | 100.0 /100 | #12 | Exceptional 4.7% |
| Bolivians | 100.0 /100 | #13 | Exceptional 4.7% |
| Germans | 100.0 /100 | #14 | Exceptional 4.7% |
| Scandinavians | 100.0 /100 | #15 | Exceptional 4.7% |
| Swiss | 99.9 /100 | #16 | Exceptional 4.7% |
| Filipinos | 99.9 /100 | #17 | Exceptional 4.7% |
| English | 99.9 /100 | #18 | Exceptional 4.8% |
| Europeans | 99.9 /100 | #19 | Exceptional 4.8% |
| Pennsylvania Germans | 99.9 /100 | #20 | Exceptional 4.8% |
| Immigrants | Taiwan | 99.9 /100 | #21 | Exceptional 4.8% |
| Carpatho Rusyns | 99.9 /100 | #22 | Exceptional 4.8% |
| Tongans | 99.9 /100 | #23 | Exceptional 4.8% |
| Immigrants | South Central Asia | 99.9 /100 | #24 | Exceptional 4.8% |
| Zimbabweans | 99.9 /100 | #25 | Exceptional 4.8% |