Immigrants from Colombia vs Blackfeet Male Unemployment
COMPARE
Immigrants from Colombia
Blackfeet
Male Unemployment
Male Unemployment Comparison
Immigrants from Colombia
Blackfeet
5.1%
MALE UNEMPLOYMENT
86.8/ 100
METRIC RATING
126th/ 347
METRIC RANK
6.0%
MALE UNEMPLOYMENT
0.0/ 100
METRIC RATING
271st/ 347
METRIC RANK
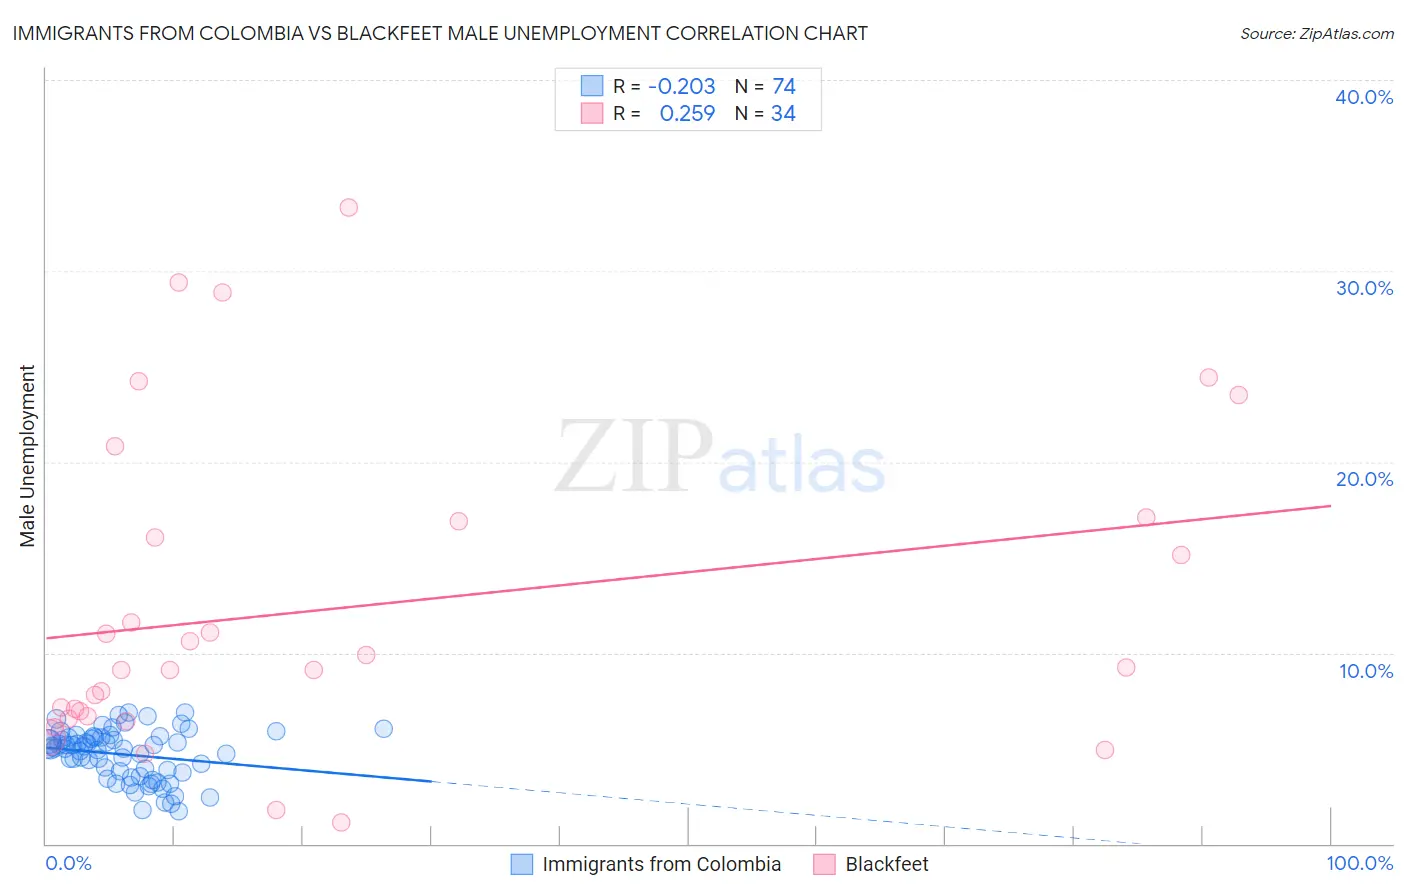
Immigrants from Colombia vs Blackfeet Male Unemployment Correlation Chart
The statistical analysis conducted on geographies consisting of 377,439,396 people shows a weak negative correlation between the proportion of Immigrants from Colombia and unemployment rate among males in the United States with a correlation coefficient (R) of -0.203 and weighted average of 5.1%. Similarly, the statistical analysis conducted on geographies consisting of 308,278,150 people shows a weak positive correlation between the proportion of Blackfeet and unemployment rate among males in the United States with a correlation coefficient (R) of 0.259 and weighted average of 6.0%, a difference of 16.3%.
Male Unemployment Correlation Summary
| Measurement | Immigrants from Colombia | Blackfeet |
| Minimum | 1.7% | 1.1% |
| Maximum | 6.9% | 33.3% |
| Range | 5.2% | 32.2% |
| Mean | 4.7% | 12.4% |
| Median | 5.0% | 9.2% |
| Interquartile 25% (IQ1) | 3.8% | 6.7% |
| Interquartile 75% (IQ3) | 5.5% | 16.9% |
| Interquartile Range (IQR) | 1.8% | 10.2% |
| Standard Deviation (Sample) | 1.3% | 8.3% |
| Standard Deviation (Population) | 1.3% | 8.2% |
Similar Demographics by Male Unemployment
Demographics Similar to Immigrants from Colombia by Male Unemployment
In terms of male unemployment, the demographic groups most similar to Immigrants from Colombia are Immigrants from Lithuania (5.1%, a difference of 0.060%), Immigrants from Brazil (5.2%, a difference of 0.060%), Immigrants from Latvia (5.1%, a difference of 0.10%), Palestinian (5.1%, a difference of 0.12%), and Nicaraguan (5.1%, a difference of 0.19%).
| Demographics | Rating | Rank | Male Unemployment |
| French Canadians | 88.6 /100 | #119 | Excellent 5.1% |
| Ukrainians | 88.4 /100 | #120 | Excellent 5.1% |
| Mongolians | 88.4 /100 | #121 | Excellent 5.1% |
| Nicaraguans | 88.2 /100 | #122 | Excellent 5.1% |
| Palestinians | 87.7 /100 | #123 | Excellent 5.1% |
| Immigrants | Latvia | 87.5 /100 | #124 | Excellent 5.1% |
| Immigrants | Lithuania | 87.2 /100 | #125 | Excellent 5.1% |
| Immigrants | Colombia | 86.8 /100 | #126 | Excellent 5.1% |
| Immigrants | Brazil | 86.3 /100 | #127 | Excellent 5.2% |
| Hungarians | 85.1 /100 | #128 | Excellent 5.2% |
| Immigrants | Western Europe | 84.8 /100 | #129 | Excellent 5.2% |
| Immigrants | Malaysia | 83.5 /100 | #130 | Excellent 5.2% |
| Immigrants | Germany | 83.0 /100 | #131 | Excellent 5.2% |
| Chickasaw | 82.9 /100 | #132 | Excellent 5.2% |
| Colombians | 81.1 /100 | #133 | Excellent 5.2% |
Demographics Similar to Blackfeet by Male Unemployment
In terms of male unemployment, the demographic groups most similar to Blackfeet are Immigrants from Uzbekistan (6.0%, a difference of 0.23%), Armenian (6.0%, a difference of 0.24%), Immigrants from Sierra Leone (6.0%, a difference of 0.41%), Subsaharan African (6.0%, a difference of 0.50%), and Menominee (6.0%, a difference of 0.57%).
| Demographics | Rating | Rank | Male Unemployment |
| Immigrants | Mexico | 0.0 /100 | #264 | Tragic 5.9% |
| French American Indians | 0.0 /100 | #265 | Tragic 5.9% |
| Bahamians | 0.0 /100 | #266 | Tragic 5.9% |
| Nigerians | 0.0 /100 | #267 | Tragic 5.9% |
| Bermudans | 0.0 /100 | #268 | Tragic 5.9% |
| Immigrants | Nigeria | 0.0 /100 | #269 | Tragic 6.0% |
| Sub-Saharan Africans | 0.0 /100 | #270 | Tragic 6.0% |
| Blackfeet | 0.0 /100 | #271 | Tragic 6.0% |
| Immigrants | Uzbekistan | 0.0 /100 | #272 | Tragic 6.0% |
| Armenians | 0.0 /100 | #273 | Tragic 6.0% |
| Immigrants | Sierra Leone | 0.0 /100 | #274 | Tragic 6.0% |
| Menominee | 0.0 /100 | #275 | Tragic 6.0% |
| Tlingit-Haida | 0.0 /100 | #276 | Tragic 6.0% |
| Immigrants | Liberia | 0.0 /100 | #277 | Tragic 6.1% |
| Immigrants | Fiji | 0.0 /100 | #278 | Tragic 6.1% |