Immigrants from Norway vs Danish Unemployment Among Women with Children Ages 6 to 17 years
COMPARE
Immigrants from Norway
Danish
Unemployment Among Women with Children Ages 6 to 17 years
Unemployment Among Women with Children Ages 6 to 17 years Comparison
Immigrants from Norway
Danes
8.6%
UNEMPLOYMENT AMONG WOMEN WITH CHILDREN AGES 6 TO 17 YEARS
97.8/ 100
METRIC RATING
105th/ 347
METRIC RANK
8.1%
UNEMPLOYMENT AMONG WOMEN WITH CHILDREN AGES 6 TO 17 YEARS
100.0/ 100
METRIC RATING
53rd/ 347
METRIC RANK
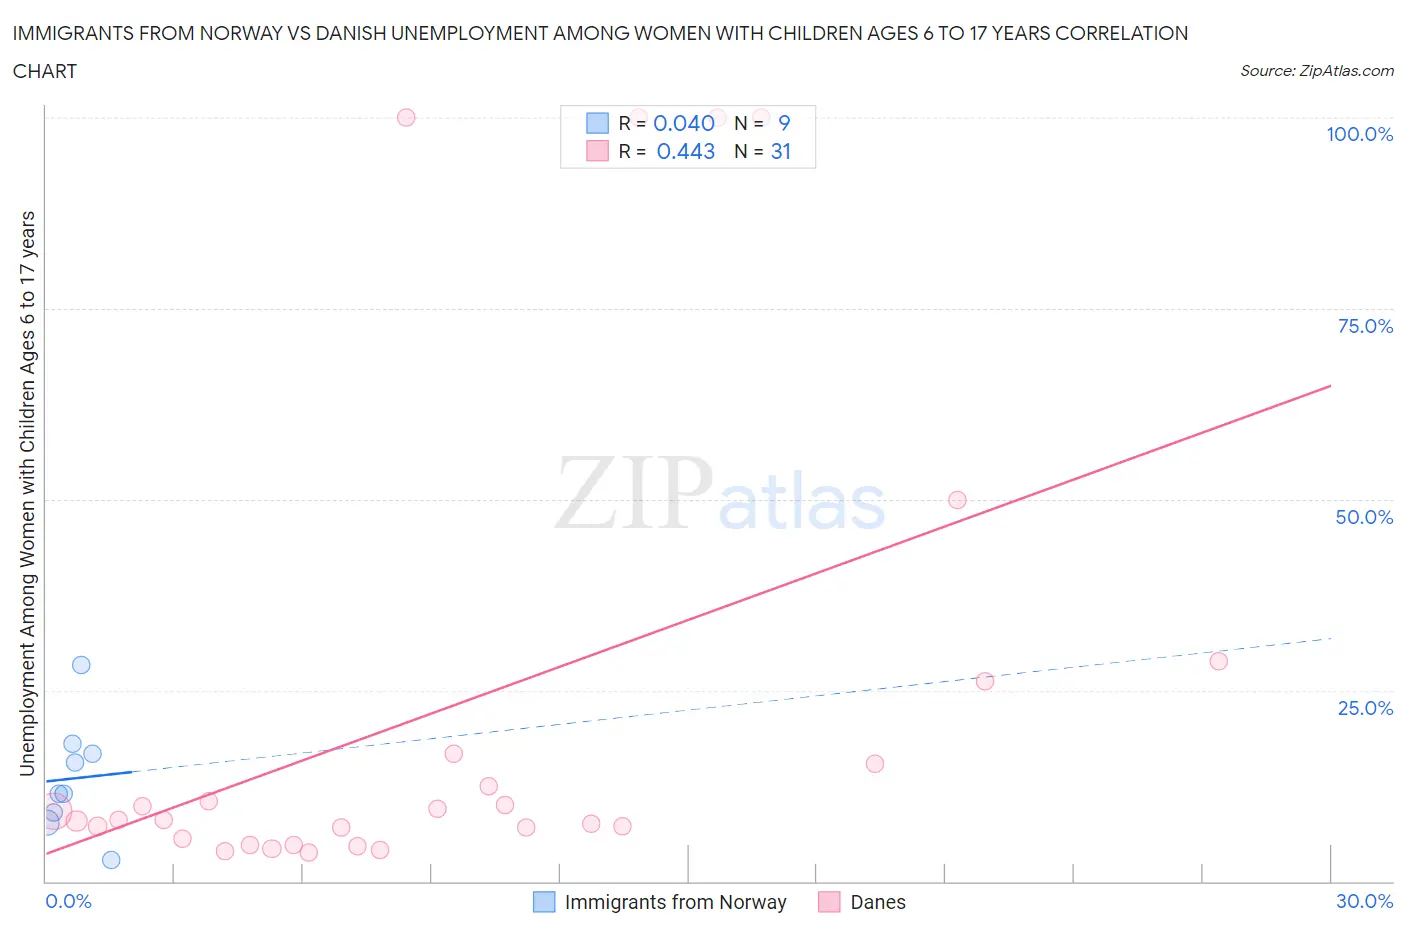
Immigrants from Norway vs Danish Unemployment Among Women with Children Ages 6 to 17 years Correlation Chart
The statistical analysis conducted on geographies consisting of 97,676,556 people shows no correlation between the proportion of Immigrants from Norway and unemployment rate among women with children between the ages 6 and 17 in the United States with a correlation coefficient (R) of 0.040 and weighted average of 8.6%. Similarly, the statistical analysis conducted on geographies consisting of 314,028,244 people shows a moderate positive correlation between the proportion of Danes and unemployment rate among women with children between the ages 6 and 17 in the United States with a correlation coefficient (R) of 0.443 and weighted average of 8.1%, a difference of 5.6%.
Unemployment Among Women with Children Ages 6 to 17 years Correlation Summary
| Measurement | Immigrants from Norway | Danish |
| Minimum | 2.8% | 3.8% |
| Maximum | 28.4% | 100.0% |
| Range | 25.6% | 96.2% |
| Mean | 13.5% | 22.4% |
| Median | 11.5% | 8.1% |
| Interquartile 25% (IQ1) | 8.3% | 5.5% |
| Interquartile 75% (IQ3) | 17.4% | 16.7% |
| Interquartile Range (IQR) | 9.1% | 11.2% |
| Standard Deviation (Sample) | 7.4% | 31.7% |
| Standard Deviation (Population) | 6.9% | 31.2% |
Similar Demographics by Unemployment Among Women with Children Ages 6 to 17 years
Demographics Similar to Immigrants from Norway by Unemployment Among Women with Children Ages 6 to 17 years
In terms of unemployment among women with children ages 6 to 17 years, the demographic groups most similar to Immigrants from Norway are Immigrants from Serbia (8.6%, a difference of 0.040%), Chickasaw (8.6%, a difference of 0.070%), Swedish (8.6%, a difference of 0.080%), Immigrants from France (8.6%, a difference of 0.15%), and Immigrants from Romania (8.6%, a difference of 0.15%).
| Demographics | Rating | Rank | Unemployment Among Women with Children Ages 6 to 17 years |
| Malaysians | 98.5 /100 | #98 | Exceptional 8.6% |
| Immigrants | Lithuania | 98.4 /100 | #99 | Exceptional 8.6% |
| New Zealanders | 98.4 /100 | #100 | Exceptional 8.6% |
| Immigrants | Pakistan | 98.4 /100 | #101 | Exceptional 8.6% |
| Immigrants | South Africa | 98.3 /100 | #102 | Exceptional 8.6% |
| Scandinavians | 98.3 /100 | #103 | Exceptional 8.6% |
| Immigrants | France | 98.0 /100 | #104 | Exceptional 8.6% |
| Immigrants | Norway | 97.8 /100 | #105 | Exceptional 8.6% |
| Immigrants | Serbia | 97.7 /100 | #106 | Exceptional 8.6% |
| Chickasaw | 97.6 /100 | #107 | Exceptional 8.6% |
| Swedes | 97.6 /100 | #108 | Exceptional 8.6% |
| Immigrants | Romania | 97.5 /100 | #109 | Exceptional 8.6% |
| Latvians | 97.4 /100 | #110 | Exceptional 8.6% |
| Immigrants | Ukraine | 97.4 /100 | #111 | Exceptional 8.6% |
| Romanians | 97.1 /100 | #112 | Exceptional 8.6% |
Demographics Similar to Danes by Unemployment Among Women with Children Ages 6 to 17 years
In terms of unemployment among women with children ages 6 to 17 years, the demographic groups most similar to Danes are Immigrants from Iraq (8.1%, a difference of 0.060%), Immigrants from Armenia (8.2%, a difference of 0.22%), Immigrants from Japan (8.2%, a difference of 0.29%), Immigrants from Bosnia and Herzegovina (8.2%, a difference of 0.30%), and Immigrants from Laos (8.2%, a difference of 0.32%).
| Demographics | Rating | Rank | Unemployment Among Women with Children Ages 6 to 17 years |
| Icelanders | 100.0 /100 | #46 | Exceptional 8.1% |
| Immigrants | Switzerland | 100.0 /100 | #47 | Exceptional 8.1% |
| Immigrants | Asia | 100.0 /100 | #48 | Exceptional 8.1% |
| Immigrants | Oceania | 100.0 /100 | #49 | Exceptional 8.1% |
| Hawaiians | 100.0 /100 | #50 | Exceptional 8.1% |
| Immigrants | Sudan | 100.0 /100 | #51 | Exceptional 8.1% |
| Immigrants | Iraq | 100.0 /100 | #52 | Exceptional 8.1% |
| Danes | 100.0 /100 | #53 | Exceptional 8.1% |
| Immigrants | Armenia | 100.0 /100 | #54 | Exceptional 8.2% |
| Immigrants | Japan | 100.0 /100 | #55 | Exceptional 8.2% |
| Immigrants | Bosnia and Herzegovina | 100.0 /100 | #56 | Exceptional 8.2% |
| Immigrants | Laos | 100.0 /100 | #57 | Exceptional 8.2% |
| Immigrants | Malaysia | 100.0 /100 | #58 | Exceptional 8.2% |
| Immigrants | Philippines | 100.0 /100 | #59 | Exceptional 8.2% |
| Basques | 100.0 /100 | #60 | Exceptional 8.2% |