Chinese vs Danish Unemployment Among Women with Children Ages 6 to 17 years
COMPARE
Chinese
Danish
Unemployment Among Women with Children Ages 6 to 17 years
Unemployment Among Women with Children Ages 6 to 17 years Comparison
Chinese
Danes
9.3%
UNEMPLOYMENT AMONG WOMEN WITH CHILDREN AGES 6 TO 17 YEARS
5.2/ 100
METRIC RATING
225th/ 347
METRIC RANK
8.1%
UNEMPLOYMENT AMONG WOMEN WITH CHILDREN AGES 6 TO 17 YEARS
100.0/ 100
METRIC RATING
53rd/ 347
METRIC RANK
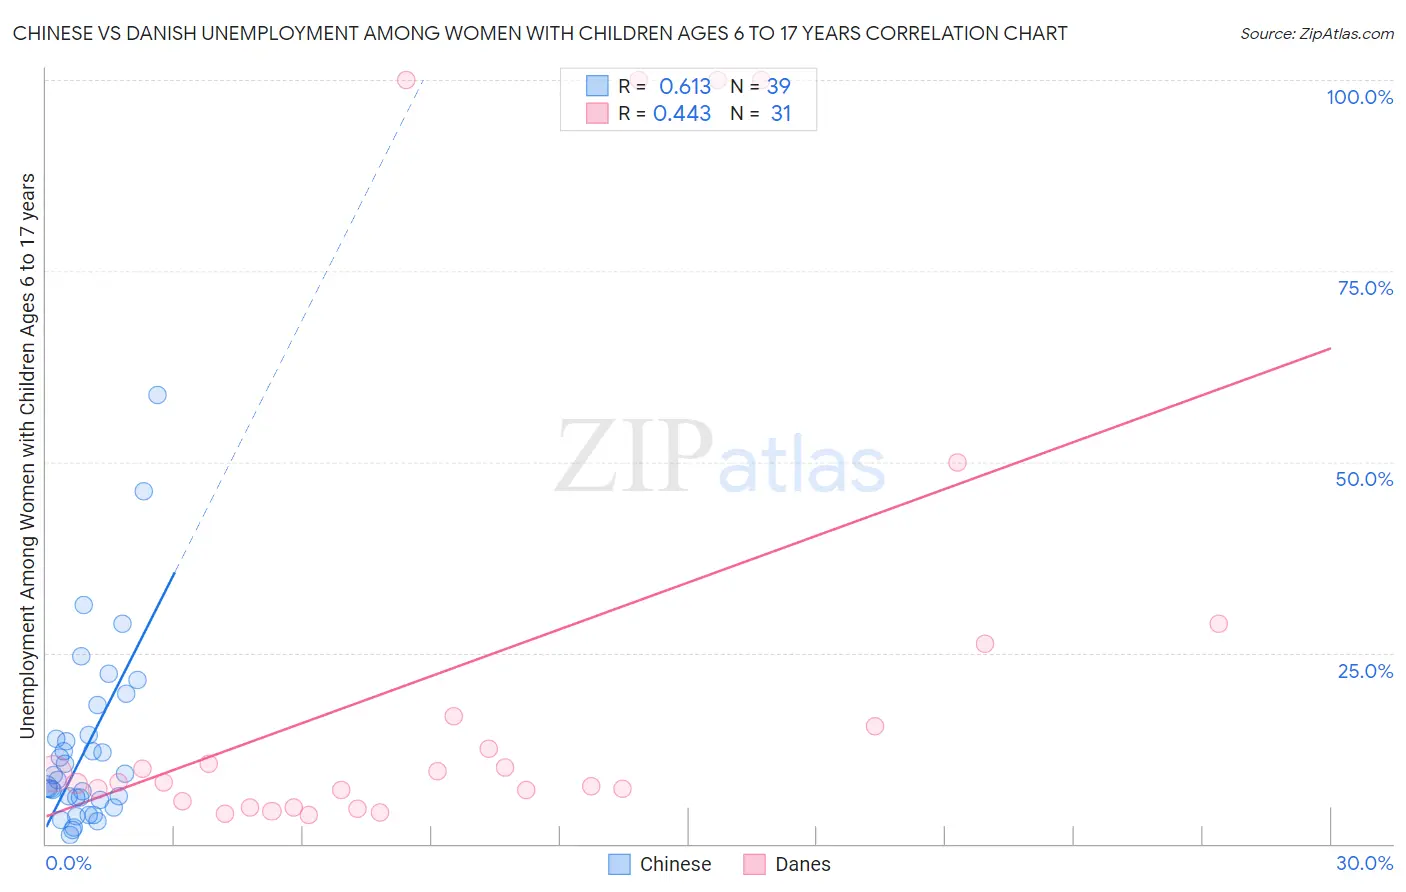
Chinese vs Danish Unemployment Among Women with Children Ages 6 to 17 years Correlation Chart
The statistical analysis conducted on geographies consisting of 57,778,036 people shows a significant positive correlation between the proportion of Chinese and unemployment rate among women with children between the ages 6 and 17 in the United States with a correlation coefficient (R) of 0.613 and weighted average of 9.3%. Similarly, the statistical analysis conducted on geographies consisting of 314,028,244 people shows a moderate positive correlation between the proportion of Danes and unemployment rate among women with children between the ages 6 and 17 in the United States with a correlation coefficient (R) of 0.443 and weighted average of 8.1%, a difference of 13.7%.
Unemployment Among Women with Children Ages 6 to 17 years Correlation Summary
| Measurement | Chinese | Danish |
| Minimum | 1.1% | 3.8% |
| Maximum | 58.7% | 100.0% |
| Range | 57.6% | 96.2% |
| Mean | 12.6% | 22.4% |
| Median | 8.3% | 8.1% |
| Interquartile 25% (IQ1) | 5.8% | 5.5% |
| Interquartile 75% (IQ3) | 14.3% | 16.7% |
| Interquartile Range (IQR) | 8.5% | 11.2% |
| Standard Deviation (Sample) | 12.1% | 31.7% |
| Standard Deviation (Population) | 11.9% | 31.2% |
Similar Demographics by Unemployment Among Women with Children Ages 6 to 17 years
Demographics Similar to Chinese by Unemployment Among Women with Children Ages 6 to 17 years
In terms of unemployment among women with children ages 6 to 17 years, the demographic groups most similar to Chinese are Immigrants from El Salvador (9.3%, a difference of 0.010%), Immigrants from Eritrea (9.2%, a difference of 0.11%), Immigrants from Southern Europe (9.2%, a difference of 0.12%), Crow (9.2%, a difference of 0.13%), and Immigrants from the Azores (9.3%, a difference of 0.14%).
| Demographics | Rating | Rank | Unemployment Among Women with Children Ages 6 to 17 years |
| Syrians | 6.9 /100 | #218 | Tragic 9.2% |
| Immigrants | Scotland | 6.6 /100 | #219 | Tragic 9.2% |
| Belgians | 6.4 /100 | #220 | Tragic 9.2% |
| Crow | 5.8 /100 | #221 | Tragic 9.2% |
| Immigrants | Southern Europe | 5.8 /100 | #222 | Tragic 9.2% |
| Immigrants | Eritrea | 5.8 /100 | #223 | Tragic 9.2% |
| Immigrants | El Salvador | 5.3 /100 | #224 | Tragic 9.3% |
| Chinese | 5.2 /100 | #225 | Tragic 9.3% |
| Immigrants | Azores | 4.6 /100 | #226 | Tragic 9.3% |
| Panamanians | 4.5 /100 | #227 | Tragic 9.3% |
| Estonians | 4.4 /100 | #228 | Tragic 9.3% |
| Lumbee | 4.3 /100 | #229 | Tragic 9.3% |
| Welsh | 4.0 /100 | #230 | Tragic 9.3% |
| Macedonians | 3.9 /100 | #231 | Tragic 9.3% |
| French American Indians | 3.7 /100 | #232 | Tragic 9.3% |
Demographics Similar to Danes by Unemployment Among Women with Children Ages 6 to 17 years
In terms of unemployment among women with children ages 6 to 17 years, the demographic groups most similar to Danes are Immigrants from Iraq (8.1%, a difference of 0.060%), Immigrants from Armenia (8.2%, a difference of 0.22%), Immigrants from Japan (8.2%, a difference of 0.29%), Immigrants from Bosnia and Herzegovina (8.2%, a difference of 0.30%), and Immigrants from Laos (8.2%, a difference of 0.32%).
| Demographics | Rating | Rank | Unemployment Among Women with Children Ages 6 to 17 years |
| Icelanders | 100.0 /100 | #46 | Exceptional 8.1% |
| Immigrants | Switzerland | 100.0 /100 | #47 | Exceptional 8.1% |
| Immigrants | Asia | 100.0 /100 | #48 | Exceptional 8.1% |
| Immigrants | Oceania | 100.0 /100 | #49 | Exceptional 8.1% |
| Hawaiians | 100.0 /100 | #50 | Exceptional 8.1% |
| Immigrants | Sudan | 100.0 /100 | #51 | Exceptional 8.1% |
| Immigrants | Iraq | 100.0 /100 | #52 | Exceptional 8.1% |
| Danes | 100.0 /100 | #53 | Exceptional 8.1% |
| Immigrants | Armenia | 100.0 /100 | #54 | Exceptional 8.2% |
| Immigrants | Japan | 100.0 /100 | #55 | Exceptional 8.2% |
| Immigrants | Bosnia and Herzegovina | 100.0 /100 | #56 | Exceptional 8.2% |
| Immigrants | Laos | 100.0 /100 | #57 | Exceptional 8.2% |
| Immigrants | Malaysia | 100.0 /100 | #58 | Exceptional 8.2% |
| Immigrants | Philippines | 100.0 /100 | #59 | Exceptional 8.2% |
| Basques | 100.0 /100 | #60 | Exceptional 8.2% |