Haitian vs Welsh Female Unemployment
COMPARE
Haitian
Welsh
Female Unemployment
Female Unemployment Comparison
Haitians
Welsh
6.1%
FEMALE UNEMPLOYMENT
0.0/ 100
METRIC RATING
288th/ 347
METRIC RANK
4.7%
FEMALE UNEMPLOYMENT
99.9/ 100
METRIC RATING
24th/ 347
METRIC RANK
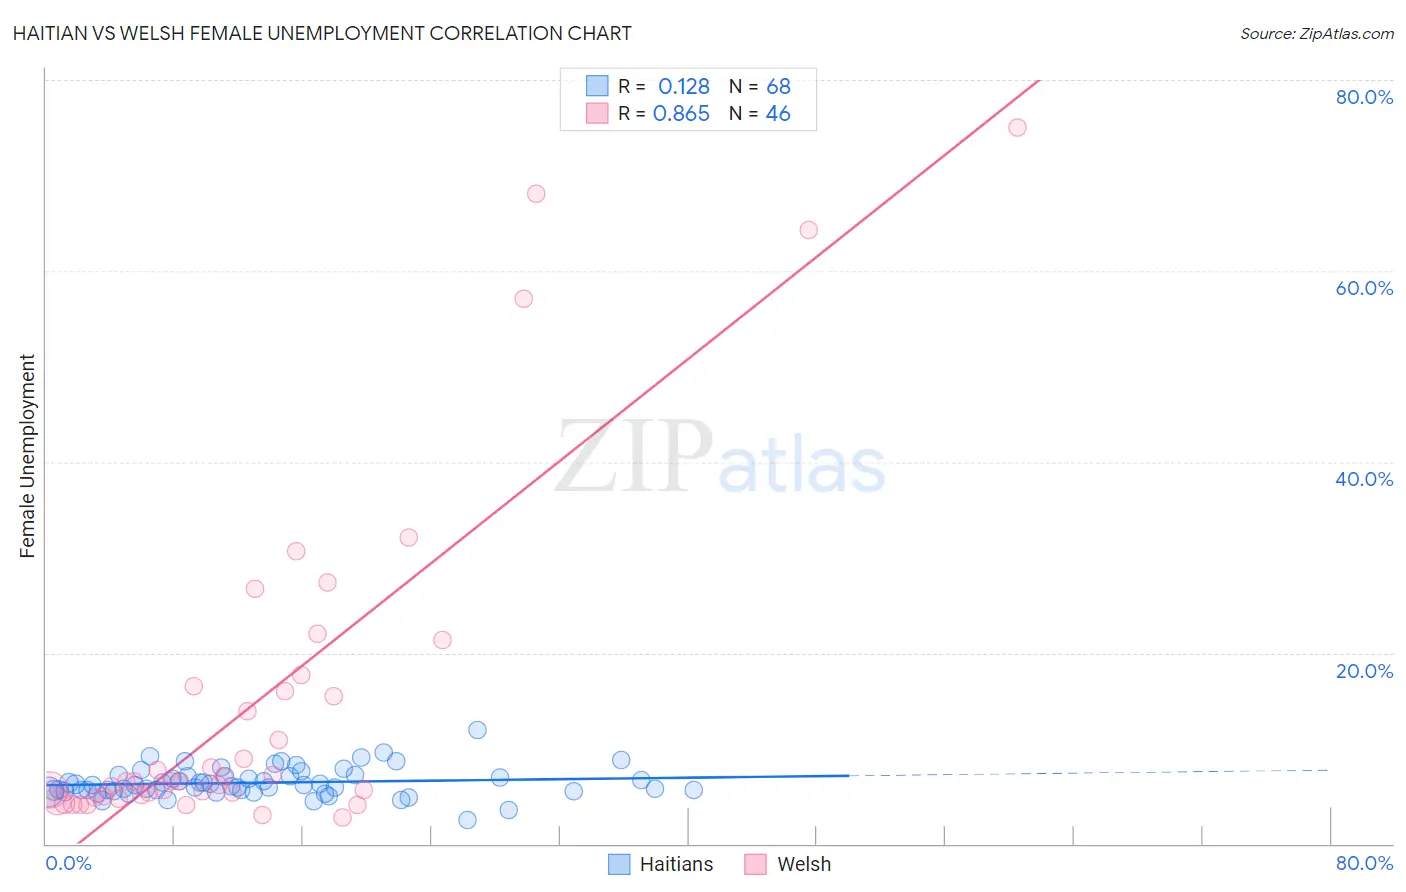
Haitian vs Welsh Female Unemployment Correlation Chart
The statistical analysis conducted on geographies consisting of 287,205,640 people shows a poor positive correlation between the proportion of Haitians and unemploymnet rate among females in the United States with a correlation coefficient (R) of 0.128 and weighted average of 6.1%. Similarly, the statistical analysis conducted on geographies consisting of 519,058,145 people shows a very strong positive correlation between the proportion of Welsh and unemploymnet rate among females in the United States with a correlation coefficient (R) of 0.865 and weighted average of 4.7%, a difference of 28.9%.
Female Unemployment Correlation Summary
| Measurement | Haitian | Welsh |
| Minimum | 2.5% | 2.8% |
| Maximum | 11.9% | 75.0% |
| Range | 9.4% | 72.2% |
| Mean | 6.4% | 14.8% |
| Median | 6.1% | 6.5% |
| Interquartile 25% (IQ1) | 5.5% | 5.0% |
| Interquartile 75% (IQ3) | 7.1% | 16.5% |
| Interquartile Range (IQR) | 1.5% | 11.5% |
| Standard Deviation (Sample) | 1.5% | 17.8% |
| Standard Deviation (Population) | 1.5% | 17.7% |
Similar Demographics by Female Unemployment
Demographics Similar to Haitians by Female Unemployment
In terms of female unemployment, the demographic groups most similar to Haitians are Trinidadian and Tobagonian (6.1%, a difference of 0.010%), Immigrants from Guatemala (6.1%, a difference of 0.040%), Chippewa (6.1%, a difference of 0.070%), Immigrants from Caribbean (6.1%, a difference of 0.070%), and Immigrants from Cabo Verde (6.1%, a difference of 0.10%).
| Demographics | Rating | Rank | Female Unemployment |
| Guatemalans | 0.0 /100 | #281 | Tragic 6.0% |
| Colville | 0.0 /100 | #282 | Tragic 6.0% |
| Salvadorans | 0.0 /100 | #283 | Tragic 6.0% |
| Immigrants | Senegal | 0.0 /100 | #284 | Tragic 6.1% |
| Immigrants | Cabo Verde | 0.0 /100 | #285 | Tragic 6.1% |
| Chippewa | 0.0 /100 | #286 | Tragic 6.1% |
| Immigrants | Guatemala | 0.0 /100 | #287 | Tragic 6.1% |
| Haitians | 0.0 /100 | #288 | Tragic 6.1% |
| Trinidadians and Tobagonians | 0.0 /100 | #289 | Tragic 6.1% |
| Immigrants | Caribbean | 0.0 /100 | #290 | Tragic 6.1% |
| Immigrants | West Indies | 0.0 /100 | #291 | Tragic 6.1% |
| Immigrants | Trinidad and Tobago | 0.0 /100 | #292 | Tragic 6.1% |
| Mexicans | 0.0 /100 | #293 | Tragic 6.1% |
| Immigrants | El Salvador | 0.0 /100 | #294 | Tragic 6.1% |
| Immigrants | Latin America | 0.0 /100 | #295 | Tragic 6.1% |
Demographics Similar to Welsh by Female Unemployment
In terms of female unemployment, the demographic groups most similar to Welsh are Immigrants from India (4.7%, a difference of 0.090%), Immigrants from Bosnia and Herzegovina (4.7%, a difference of 0.13%), Scottish (4.7%, a difference of 0.21%), British (4.7%, a difference of 0.29%), and Irish (4.7%, a difference of 0.32%).
| Demographics | Rating | Rank | Female Unemployment |
| Croatians | 99.9 /100 | #17 | Exceptional 4.7% |
| Latvians | 99.9 /100 | #18 | Exceptional 4.7% |
| Poles | 99.9 /100 | #19 | Exceptional 4.7% |
| Bulgarians | 99.9 /100 | #20 | Exceptional 4.7% |
| Fijians | 99.9 /100 | #21 | Exceptional 4.7% |
| Europeans | 99.9 /100 | #22 | Exceptional 4.7% |
| Scottish | 99.9 /100 | #23 | Exceptional 4.7% |
| Welsh | 99.9 /100 | #24 | Exceptional 4.7% |
| Immigrants | India | 99.9 /100 | #25 | Exceptional 4.7% |
| Immigrants | Bosnia and Herzegovina | 99.9 /100 | #26 | Exceptional 4.7% |
| British | 99.9 /100 | #27 | Exceptional 4.7% |
| Irish | 99.9 /100 | #28 | Exceptional 4.7% |
| Cypriots | 99.9 /100 | #29 | Exceptional 4.7% |
| Lithuanians | 99.8 /100 | #30 | Exceptional 4.7% |
| Sudanese | 99.8 /100 | #31 | Exceptional 4.8% |