Luxembourger vs Welsh Female Unemployment
COMPARE
Luxembourger
Welsh
Female Unemployment
Female Unemployment Comparison
Luxembourgers
Welsh
4.4%
FEMALE UNEMPLOYMENT
100.0/ 100
METRIC RATING
3rd/ 347
METRIC RANK
4.7%
FEMALE UNEMPLOYMENT
99.9/ 100
METRIC RATING
24th/ 347
METRIC RANK
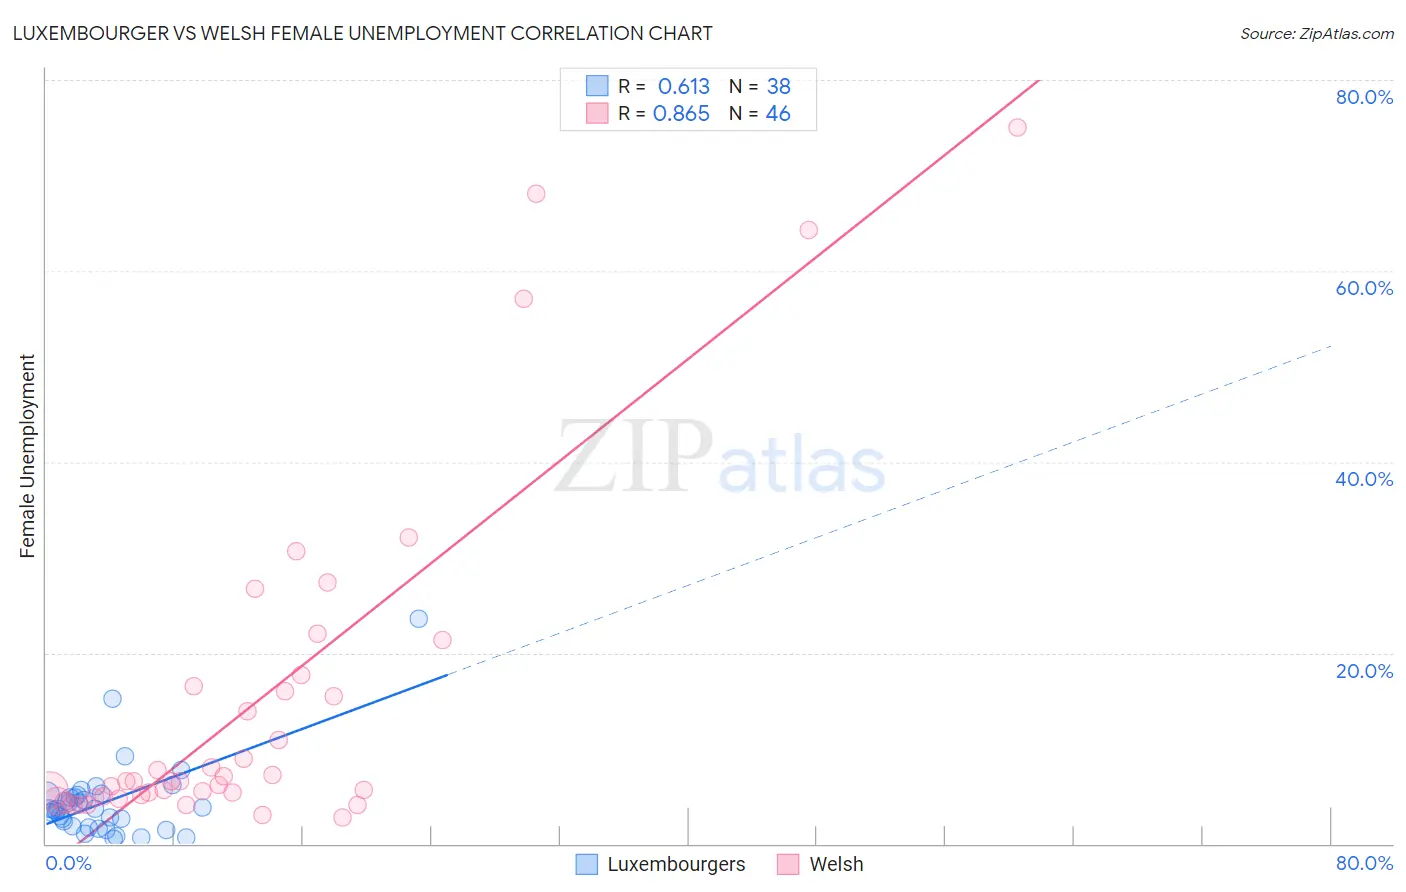
Luxembourger vs Welsh Female Unemployment Correlation Chart
The statistical analysis conducted on geographies consisting of 144,033,637 people shows a significant positive correlation between the proportion of Luxembourgers and unemploymnet rate among females in the United States with a correlation coefficient (R) of 0.613 and weighted average of 4.4%. Similarly, the statistical analysis conducted on geographies consisting of 519,058,145 people shows a very strong positive correlation between the proportion of Welsh and unemploymnet rate among females in the United States with a correlation coefficient (R) of 0.865 and weighted average of 4.7%, a difference of 7.6%.
Female Unemployment Correlation Summary
| Measurement | Luxembourger | Welsh |
| Minimum | 0.50% | 2.8% |
| Maximum | 23.6% | 75.0% |
| Range | 23.1% | 72.2% |
| Mean | 4.4% | 14.8% |
| Median | 3.7% | 6.5% |
| Interquartile 25% (IQ1) | 1.8% | 5.0% |
| Interquartile 75% (IQ3) | 5.1% | 16.5% |
| Interquartile Range (IQR) | 3.2% | 11.5% |
| Standard Deviation (Sample) | 4.2% | 17.8% |
| Standard Deviation (Population) | 4.2% | 17.7% |
Similar Demographics by Female Unemployment
Demographics Similar to Luxembourgers by Female Unemployment
In terms of female unemployment, the demographic groups most similar to Luxembourgers are Czech (4.4%, a difference of 0.010%), Danish (4.4%, a difference of 0.030%), Hmong (4.4%, a difference of 0.14%), Swedish (4.4%, a difference of 1.4%), and Chinese (4.5%, a difference of 2.2%).
| Demographics | Rating | Rank | Female Unemployment |
| Norwegians | 100.0 /100 | #1 | Exceptional 4.2% |
| Czechs | 100.0 /100 | #2 | Exceptional 4.4% |
| Luxembourgers | 100.0 /100 | #3 | Exceptional 4.4% |
| Danes | 100.0 /100 | #4 | Exceptional 4.4% |
| Hmong | 100.0 /100 | #5 | Exceptional 4.4% |
| Swedes | 100.0 /100 | #6 | Exceptional 4.4% |
| Chinese | 100.0 /100 | #7 | Exceptional 4.5% |
| Germans | 100.0 /100 | #8 | Exceptional 4.5% |
| Slovenes | 100.0 /100 | #9 | Exceptional 4.5% |
| Swiss | 100.0 /100 | #10 | Exceptional 4.6% |
| Scandinavians | 100.0 /100 | #11 | Exceptional 4.6% |
| Dutch | 100.0 /100 | #12 | Exceptional 4.6% |
| Belgians | 100.0 /100 | #13 | Exceptional 4.6% |
| Finns | 100.0 /100 | #14 | Exceptional 4.6% |
| English | 100.0 /100 | #15 | Exceptional 4.6% |
Demographics Similar to Welsh by Female Unemployment
In terms of female unemployment, the demographic groups most similar to Welsh are Immigrants from India (4.7%, a difference of 0.090%), Immigrants from Bosnia and Herzegovina (4.7%, a difference of 0.13%), Scottish (4.7%, a difference of 0.21%), British (4.7%, a difference of 0.29%), and Irish (4.7%, a difference of 0.32%).
| Demographics | Rating | Rank | Female Unemployment |
| Croatians | 99.9 /100 | #17 | Exceptional 4.7% |
| Latvians | 99.9 /100 | #18 | Exceptional 4.7% |
| Poles | 99.9 /100 | #19 | Exceptional 4.7% |
| Bulgarians | 99.9 /100 | #20 | Exceptional 4.7% |
| Fijians | 99.9 /100 | #21 | Exceptional 4.7% |
| Europeans | 99.9 /100 | #22 | Exceptional 4.7% |
| Scottish | 99.9 /100 | #23 | Exceptional 4.7% |
| Welsh | 99.9 /100 | #24 | Exceptional 4.7% |
| Immigrants | India | 99.9 /100 | #25 | Exceptional 4.7% |
| Immigrants | Bosnia and Herzegovina | 99.9 /100 | #26 | Exceptional 4.7% |
| British | 99.9 /100 | #27 | Exceptional 4.7% |
| Irish | 99.9 /100 | #28 | Exceptional 4.7% |
| Cypriots | 99.9 /100 | #29 | Exceptional 4.7% |
| Lithuanians | 99.8 /100 | #30 | Exceptional 4.7% |
| Sudanese | 99.8 /100 | #31 | Exceptional 4.8% |