Immigrants from Northern Europe vs Slavic Female Unemployment
COMPARE
Immigrants from Northern Europe
Slavic
Female Unemployment
Female Unemployment Comparison
Immigrants from Northern Europe
Slavs
4.9%
FEMALE UNEMPLOYMENT
98.0/ 100
METRIC RATING
72nd/ 347
METRIC RANK
4.9%
FEMALE UNEMPLOYMENT
99.1/ 100
METRIC RATING
52nd/ 347
METRIC RANK
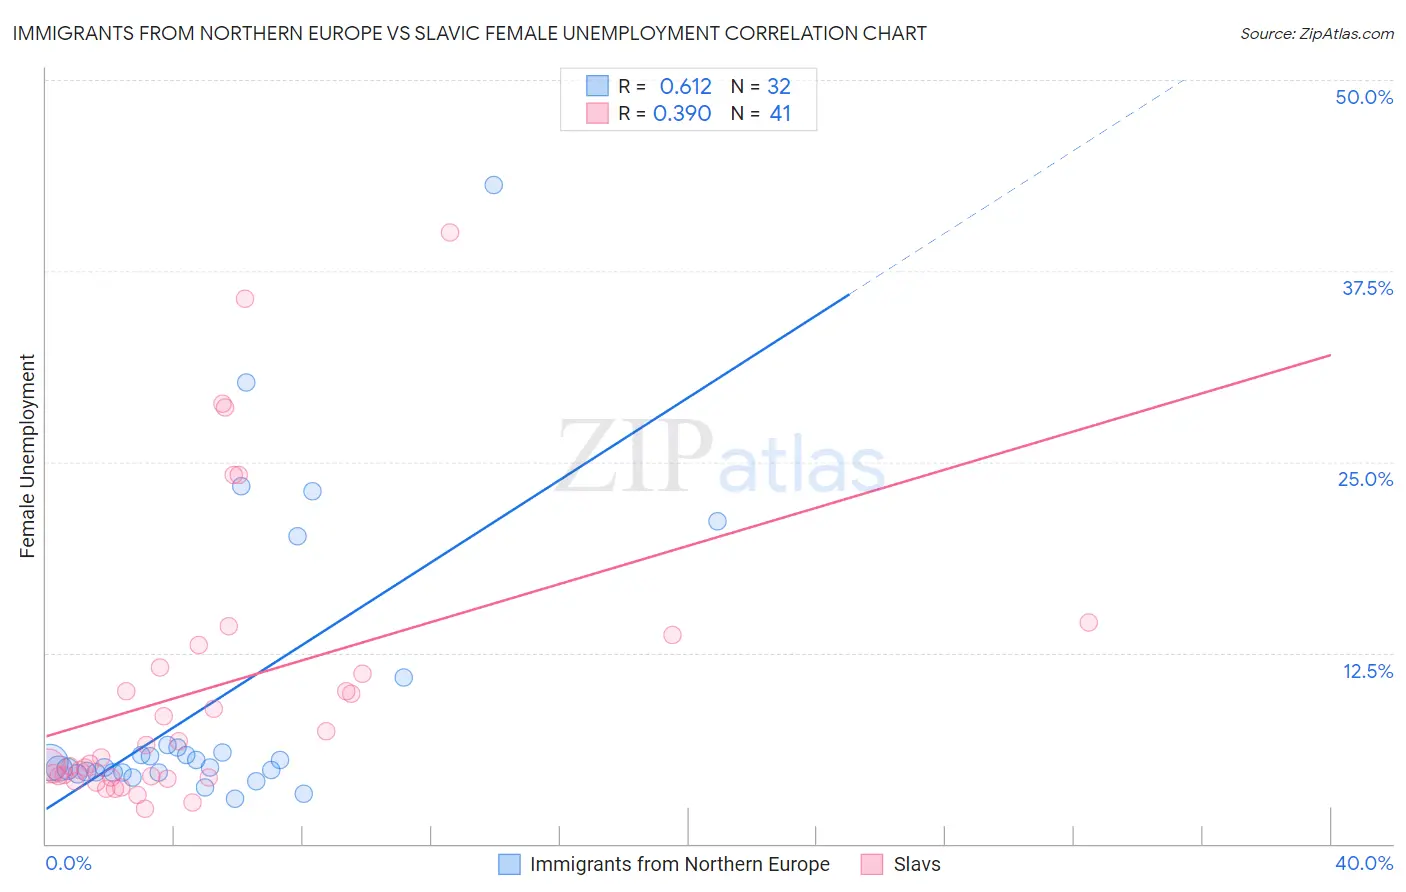
Immigrants from Northern Europe vs Slavic Female Unemployment Correlation Chart
The statistical analysis conducted on geographies consisting of 473,051,812 people shows a significant positive correlation between the proportion of Immigrants from Northern Europe and unemploymnet rate among females in the United States with a correlation coefficient (R) of 0.612 and weighted average of 4.9%. Similarly, the statistical analysis conducted on geographies consisting of 269,881,664 people shows a mild positive correlation between the proportion of Slavs and unemploymnet rate among females in the United States with a correlation coefficient (R) of 0.390 and weighted average of 4.9%, a difference of 1.2%.
Female Unemployment Correlation Summary
| Measurement | Immigrants from Northern Europe | Slavic |
| Minimum | 3.0% | 2.3% |
| Maximum | 43.1% | 40.0% |
| Range | 40.1% | 37.7% |
| Mean | 9.2% | 10.1% |
| Median | 5.1% | 5.7% |
| Interquartile 25% (IQ1) | 4.7% | 4.3% |
| Interquartile 75% (IQ3) | 6.4% | 12.3% |
| Interquartile Range (IQR) | 1.7% | 7.9% |
| Standard Deviation (Sample) | 9.4% | 9.3% |
| Standard Deviation (Population) | 9.2% | 9.2% |
Demographics Similar to Immigrants from Northern Europe and Slavs by Female Unemployment
In terms of female unemployment, the demographic groups most similar to Immigrants from Northern Europe are German Russian (4.9%, a difference of 0.070%), Osage (4.9%, a difference of 0.14%), Immigrants from Ireland (4.9%, a difference of 0.18%), Tlingit-Haida (4.9%, a difference of 0.19%), and Cuban (4.9%, a difference of 0.20%). Similarly, the demographic groups most similar to Slavs are White/Caucasian (4.9%, a difference of 0.030%), Immigrants from Zimbabwe (4.9%, a difference of 0.090%), Immigrants from Moldova (4.9%, a difference of 0.10%), Serbian (4.9%, a difference of 0.12%), and Icelander (4.9%, a difference of 0.36%).
| Demographics | Rating | Rank | Female Unemployment |
| Slavs | 99.1 /100 | #52 | Exceptional 4.9% |
| Whites/Caucasians | 99.0 /100 | #53 | Exceptional 4.9% |
| Immigrants | Zimbabwe | 99.0 /100 | #54 | Exceptional 4.9% |
| Immigrants | Moldova | 99.0 /100 | #55 | Exceptional 4.9% |
| Serbians | 99.0 /100 | #56 | Exceptional 4.9% |
| Icelanders | 98.8 /100 | #57 | Exceptional 4.9% |
| Immigrants | Lithuania | 98.8 /100 | #58 | Exceptional 4.9% |
| Bhutanese | 98.7 /100 | #59 | Exceptional 4.9% |
| Immigrants | Scotland | 98.6 /100 | #60 | Exceptional 4.9% |
| Immigrants | Canada | 98.6 /100 | #61 | Exceptional 4.9% |
| Immigrants | Nepal | 98.6 /100 | #62 | Exceptional 4.9% |
| Immigrants | Belgium | 98.5 /100 | #63 | Exceptional 4.9% |
| Celtics | 98.5 /100 | #64 | Exceptional 4.9% |
| Immigrants | North America | 98.3 /100 | #65 | Exceptional 4.9% |
| Hungarians | 98.3 /100 | #66 | Exceptional 4.9% |
| Cubans | 98.3 /100 | #67 | Exceptional 4.9% |
| Tlingit-Haida | 98.3 /100 | #68 | Exceptional 4.9% |
| Immigrants | Ireland | 98.2 /100 | #69 | Exceptional 4.9% |
| Osage | 98.2 /100 | #70 | Exceptional 4.9% |
| German Russians | 98.1 /100 | #71 | Exceptional 4.9% |
| Immigrants | Northern Europe | 98.0 /100 | #72 | Exceptional 4.9% |