Polish vs Immigrants from Ireland Unemployment
COMPARE
Polish
Immigrants from Ireland
Unemployment
Unemployment Comparison
Poles
Immigrants from Ireland
4.7%
UNEMPLOYMENT
99.8/ 100
METRIC RATING
29th/ 347
METRIC RANK
5.1%
UNEMPLOYMENT
92.1/ 100
METRIC RATING
114th/ 347
METRIC RANK
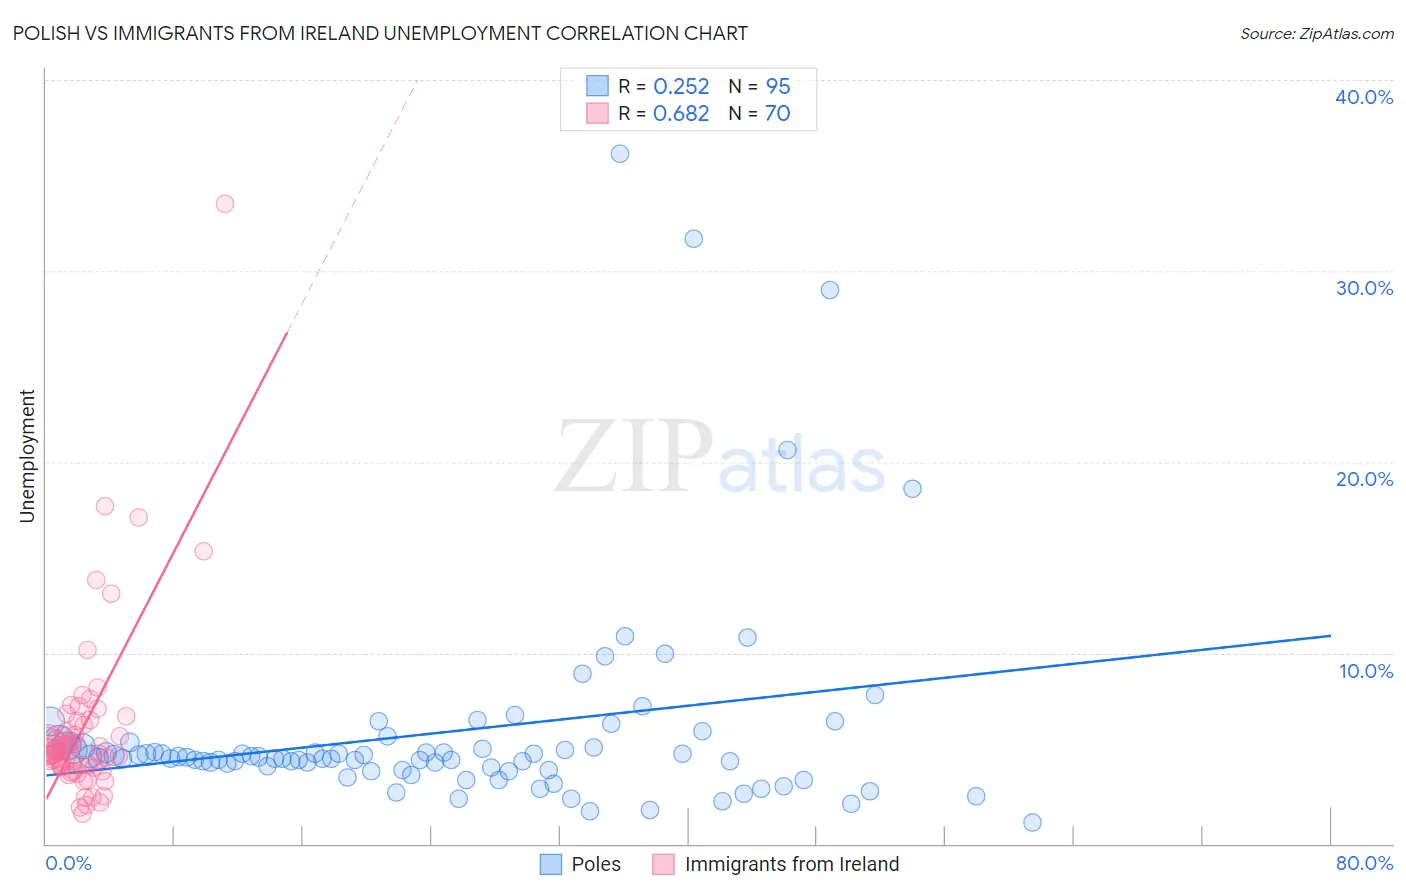
Polish vs Immigrants from Ireland Unemployment Correlation Chart
The statistical analysis conducted on geographies consisting of 557,090,134 people shows a weak positive correlation between the proportion of Poles and unemployment in the United States with a correlation coefficient (R) of 0.252 and weighted average of 4.7%. Similarly, the statistical analysis conducted on geographies consisting of 240,659,680 people shows a significant positive correlation between the proportion of Immigrants from Ireland and unemployment in the United States with a correlation coefficient (R) of 0.682 and weighted average of 5.1%, a difference of 6.6%.
Unemployment Correlation Summary
| Measurement | Polish | Immigrants from Ireland |
| Minimum | 1.1% | 1.6% |
| Maximum | 36.2% | 33.5% |
| Range | 35.1% | 31.9% |
| Mean | 5.8% | 6.0% |
| Median | 4.5% | 4.9% |
| Interquartile 25% (IQ1) | 3.9% | 4.1% |
| Interquartile 75% (IQ3) | 5.1% | 6.2% |
| Interquartile Range (IQR) | 1.2% | 2.1% |
| Standard Deviation (Sample) | 5.6% | 4.6% |
| Standard Deviation (Population) | 5.5% | 4.6% |
Similar Demographics by Unemployment
Demographics Similar to Poles by Unemployment
In terms of unemployment, the demographic groups most similar to Poles are Cuban (4.7%, a difference of 0.12%), Irish (4.8%, a difference of 0.24%), Croatian (4.8%, a difference of 0.26%), Zimbabwean (4.8%, a difference of 0.36%), and Sudanese (4.8%, a difference of 0.37%).
| Demographics | Rating | Rank | Unemployment |
| Thais | 99.9 /100 | #22 | Exceptional 4.7% |
| British | 99.9 /100 | #23 | Exceptional 4.7% |
| Venezuelans | 99.9 /100 | #24 | Exceptional 4.7% |
| Latvians | 99.9 /100 | #25 | Exceptional 4.7% |
| Bulgarians | 99.9 /100 | #26 | Exceptional 4.7% |
| Finns | 99.9 /100 | #27 | Exceptional 4.7% |
| Cubans | 99.8 /100 | #28 | Exceptional 4.7% |
| Poles | 99.8 /100 | #29 | Exceptional 4.7% |
| Irish | 99.8 /100 | #30 | Exceptional 4.8% |
| Croatians | 99.8 /100 | #31 | Exceptional 4.8% |
| Zimbabweans | 99.8 /100 | #32 | Exceptional 4.8% |
| Sudanese | 99.8 /100 | #33 | Exceptional 4.8% |
| Immigrants | Bolivia | 99.8 /100 | #34 | Exceptional 4.8% |
| Scotch-Irish | 99.8 /100 | #35 | Exceptional 4.8% |
| Tongans | 99.7 /100 | #36 | Exceptional 4.8% |
Demographics Similar to Immigrants from Ireland by Unemployment
In terms of unemployment, the demographic groups most similar to Immigrants from Ireland are Argentinean (5.1%, a difference of 0.060%), South African (5.1%, a difference of 0.10%), Immigrants from Western Europe (5.1%, a difference of 0.21%), Immigrants from Sri Lanka (5.1%, a difference of 0.22%), and Immigrants from Malaysia (5.1%, a difference of 0.24%).
| Demographics | Rating | Rank | Unemployment |
| Immigrants | Turkey | 93.7 /100 | #107 | Exceptional 5.0% |
| Immigrants | Kuwait | 93.7 /100 | #108 | Exceptional 5.0% |
| Immigrants | Eritrea | 93.3 /100 | #109 | Exceptional 5.0% |
| Immigrants | Lithuania | 93.2 /100 | #110 | Exceptional 5.0% |
| Chileans | 93.2 /100 | #111 | Exceptional 5.0% |
| South Africans | 92.6 /100 | #112 | Exceptional 5.1% |
| Argentineans | 92.4 /100 | #113 | Exceptional 5.1% |
| Immigrants | Ireland | 92.1 /100 | #114 | Exceptional 5.1% |
| Immigrants | Western Europe | 91.1 /100 | #115 | Exceptional 5.1% |
| Immigrants | Sri Lanka | 91.1 /100 | #116 | Exceptional 5.1% |
| Immigrants | Malaysia | 91.0 /100 | #117 | Exceptional 5.1% |
| Immigrants | Germany | 90.8 /100 | #118 | Exceptional 5.1% |
| Immigrants | France | 89.7 /100 | #119 | Excellent 5.1% |
| Macedonians | 89.7 /100 | #120 | Excellent 5.1% |
| Lebanese | 89.2 /100 | #121 | Excellent 5.1% |