Immigrants from North America vs Peruvian Unemployment Among Ages 30 to 34 years
COMPARE
Immigrants from North America
Peruvian
Unemployment Among Ages 30 to 34 years
Unemployment Among Ages 30 to 34 years Comparison
Immigrants from North America
Peruvians
5.4%
UNEMPLOYMENT AMONG AGES 30 TO 34 YEARS
72.2/ 100
METRIC RATING
140th/ 347
METRIC RANK
5.5%
UNEMPLOYMENT AMONG AGES 30 TO 34 YEARS
50.2/ 100
METRIC RATING
173rd/ 347
METRIC RANK
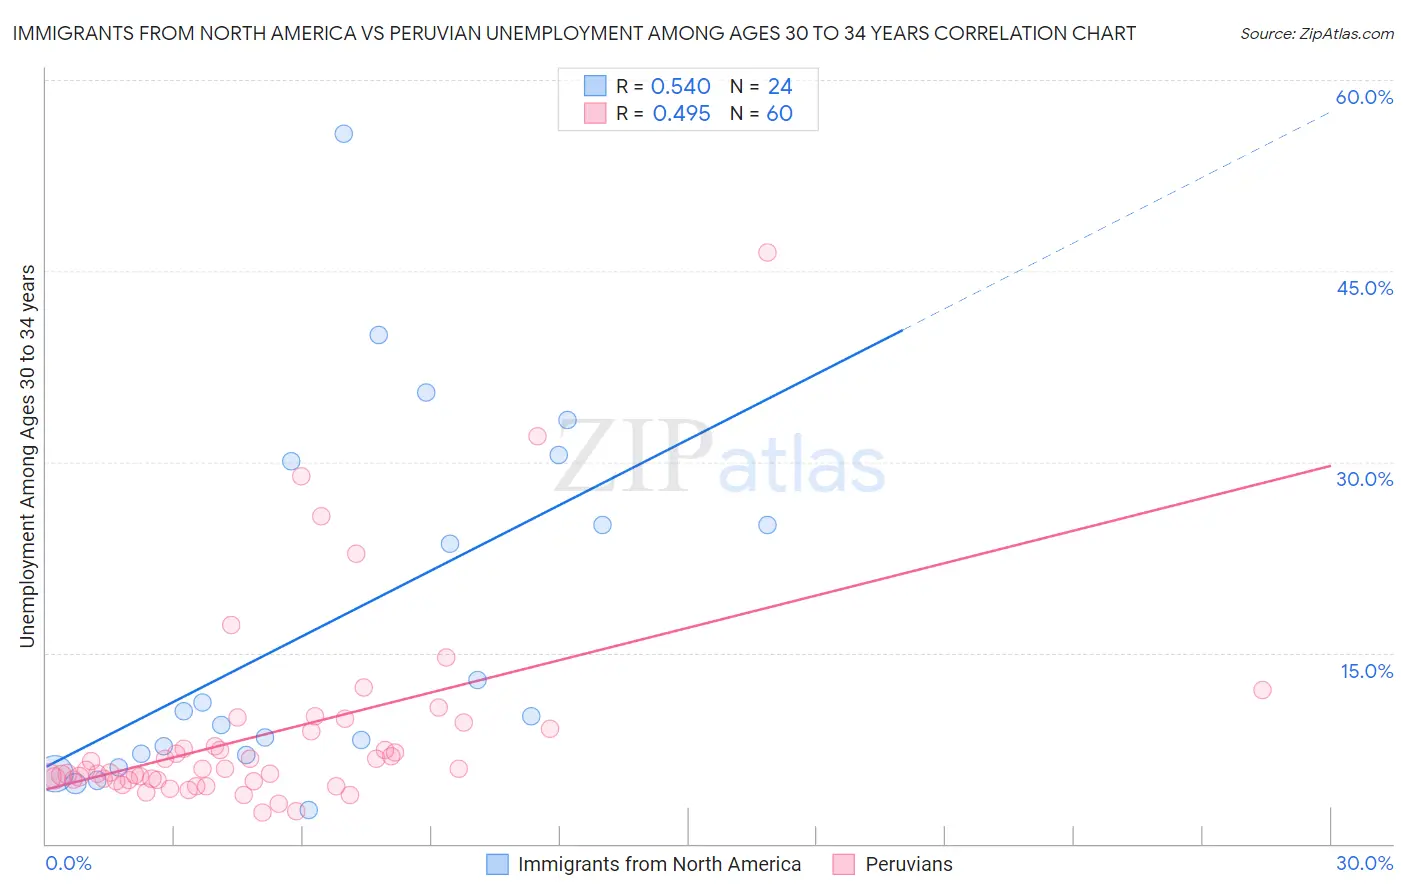
Immigrants from North America vs Peruvian Unemployment Among Ages 30 to 34 years Correlation Chart
The statistical analysis conducted on geographies consisting of 425,298,151 people shows a substantial positive correlation between the proportion of Immigrants from North America and unemployment rate among population between the ages 30 and 34 in the United States with a correlation coefficient (R) of 0.540 and weighted average of 5.4%. Similarly, the statistical analysis conducted on geographies consisting of 346,915,622 people shows a moderate positive correlation between the proportion of Peruvians and unemployment rate among population between the ages 30 and 34 in the United States with a correlation coefficient (R) of 0.495 and weighted average of 5.5%, a difference of 1.7%.
Unemployment Among Ages 30 to 34 years Correlation Summary
| Measurement | Immigrants from North America | Peruvian |
| Minimum | 2.7% | 2.5% |
| Maximum | 55.8% | 46.4% |
| Range | 53.1% | 43.9% |
| Mean | 17.3% | 8.6% |
| Median | 10.2% | 5.8% |
| Interquartile 25% (IQ1) | 7.0% | 5.0% |
| Interquartile 75% (IQ3) | 27.5% | 8.9% |
| Interquartile Range (IQR) | 20.5% | 4.0% |
| Standard Deviation (Sample) | 14.1% | 7.8% |
| Standard Deviation (Population) | 13.8% | 7.7% |
Similar Demographics by Unemployment Among Ages 30 to 34 years
Demographics Similar to Immigrants from North America by Unemployment Among Ages 30 to 34 years
In terms of unemployment among ages 30 to 34 years, the demographic groups most similar to Immigrants from North America are Lithuanian (5.4%, a difference of 0.020%), Immigrants from Europe (5.4%, a difference of 0.020%), Immigrants from Greece (5.4%, a difference of 0.020%), Serbian (5.4%, a difference of 0.060%), and Russian (5.4%, a difference of 0.090%).
| Demographics | Rating | Rank | Unemployment Among Ages 30 to 34 years |
| Immigrants | Northern Europe | 77.3 /100 | #133 | Good 5.3% |
| Bangladeshis | 76.6 /100 | #134 | Good 5.3% |
| Palestinians | 75.1 /100 | #135 | Good 5.4% |
| Pakistanis | 74.6 /100 | #136 | Good 5.4% |
| Immigrants | Canada | 74.6 /100 | #137 | Good 5.4% |
| Serbians | 72.9 /100 | #138 | Good 5.4% |
| Lithuanians | 72.4 /100 | #139 | Good 5.4% |
| Immigrants | North America | 72.2 /100 | #140 | Good 5.4% |
| Immigrants | Europe | 72.1 /100 | #141 | Good 5.4% |
| Immigrants | Greece | 72.0 /100 | #142 | Good 5.4% |
| Russians | 71.1 /100 | #143 | Good 5.4% |
| Immigrants | Russia | 71.0 /100 | #144 | Good 5.4% |
| Syrians | 70.3 /100 | #145 | Good 5.4% |
| Celtics | 70.2 /100 | #146 | Good 5.4% |
| Ukrainians | 69.2 /100 | #147 | Good 5.4% |
Demographics Similar to Peruvians by Unemployment Among Ages 30 to 34 years
In terms of unemployment among ages 30 to 34 years, the demographic groups most similar to Peruvians are Immigrants from Laos (5.5%, a difference of 0.010%), Afghan (5.5%, a difference of 0.040%), Immigrants from Austria (5.5%, a difference of 0.080%), Scottish (5.5%, a difference of 0.11%), and Immigrants from Peru (5.5%, a difference of 0.15%).
| Demographics | Rating | Rank | Unemployment Among Ages 30 to 34 years |
| Immigrants | Thailand | 55.6 /100 | #166 | Average 5.4% |
| English | 54.8 /100 | #167 | Average 5.4% |
| South Americans | 52.9 /100 | #168 | Average 5.4% |
| Immigrants | Israel | 52.9 /100 | #169 | Average 5.4% |
| Dutch | 52.6 /100 | #170 | Average 5.5% |
| Scottish | 51.8 /100 | #171 | Average 5.5% |
| Immigrants | Austria | 51.3 /100 | #172 | Average 5.5% |
| Peruvians | 50.2 /100 | #173 | Average 5.5% |
| Immigrants | Laos | 50.0 /100 | #174 | Average 5.5% |
| Afghans | 49.6 /100 | #175 | Average 5.5% |
| Immigrants | Peru | 48.0 /100 | #176 | Average 5.5% |
| Immigrants | Ukraine | 47.7 /100 | #177 | Average 5.5% |
| Macedonians | 47.1 /100 | #178 | Average 5.5% |
| Costa Ricans | 46.7 /100 | #179 | Average 5.5% |
| Italians | 45.5 /100 | #180 | Average 5.5% |