Immigrants from Caribbean vs Immigrants from Netherlands Unemployment Among Ages 30 to 34 years
COMPARE
Immigrants from Caribbean
Immigrants from Netherlands
Unemployment Among Ages 30 to 34 years
Unemployment Among Ages 30 to 34 years Comparison
Immigrants from Caribbean
Immigrants from Netherlands
6.4%
UNEMPLOYMENT AMONG AGES 30 TO 34 YEARS
0.0/ 100
METRIC RATING
281st/ 347
METRIC RANK
5.3%
UNEMPLOYMENT AMONG AGES 30 TO 34 YEARS
81.8/ 100
METRIC RATING
122nd/ 347
METRIC RANK
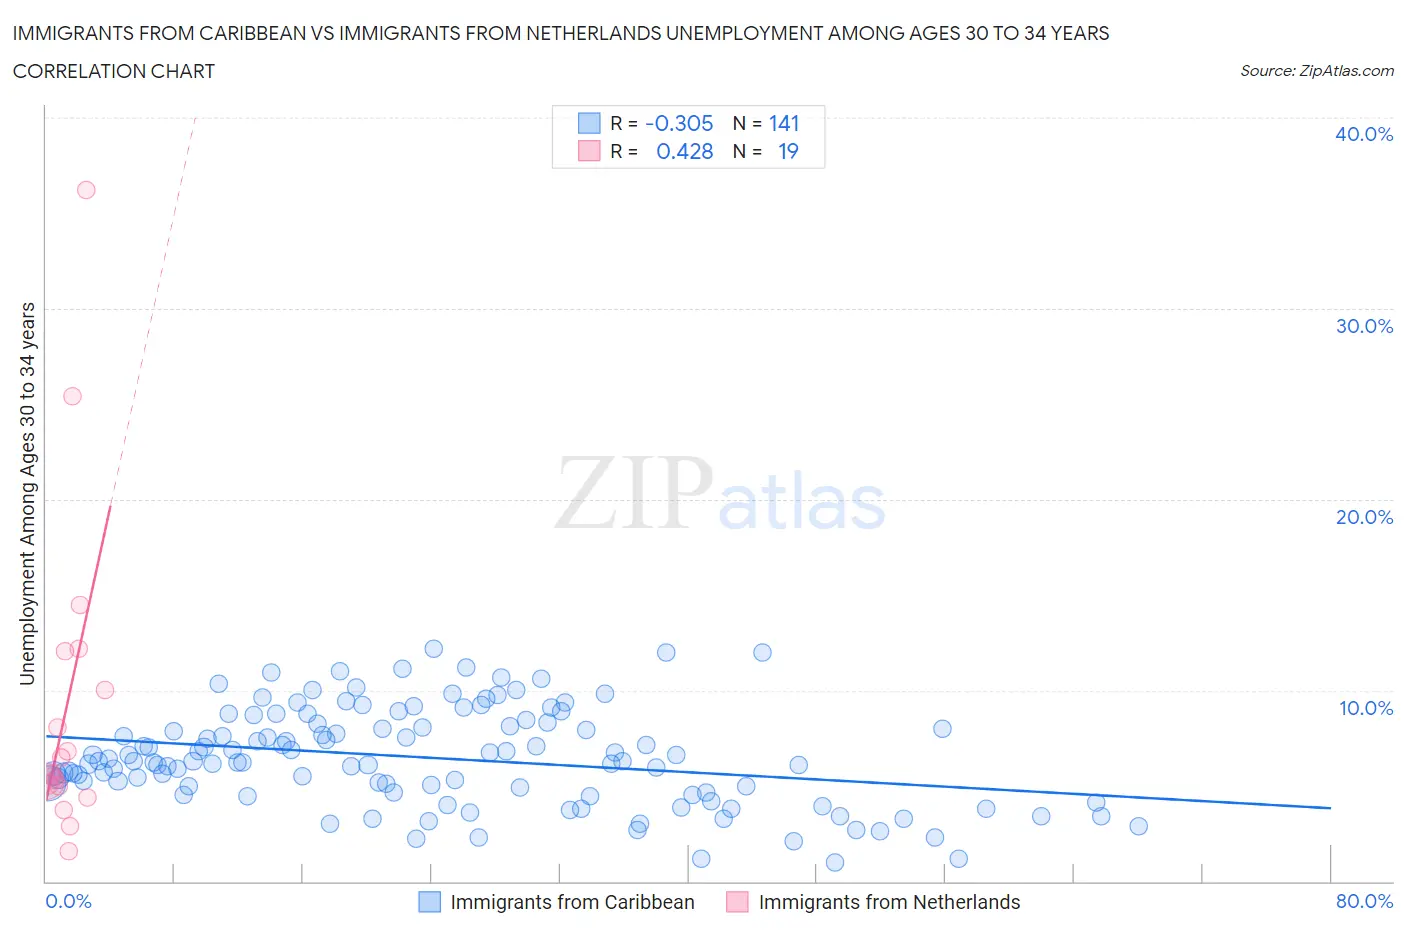
Immigrants from Caribbean vs Immigrants from Netherlands Unemployment Among Ages 30 to 34 years Correlation Chart
The statistical analysis conducted on geographies consisting of 419,806,633 people shows a mild negative correlation between the proportion of Immigrants from Caribbean and unemployment rate among population between the ages 30 and 34 in the United States with a correlation coefficient (R) of -0.305 and weighted average of 6.4%. Similarly, the statistical analysis conducted on geographies consisting of 227,644,574 people shows a moderate positive correlation between the proportion of Immigrants from Netherlands and unemployment rate among population between the ages 30 and 34 in the United States with a correlation coefficient (R) of 0.428 and weighted average of 5.3%, a difference of 20.2%.
Unemployment Among Ages 30 to 34 years Correlation Summary
| Measurement | Immigrants from Caribbean | Immigrants from Netherlands |
| Minimum | 1.0% | 1.6% |
| Maximum | 12.2% | 36.2% |
| Range | 11.2% | 34.6% |
| Mean | 6.5% | 9.3% |
| Median | 6.3% | 5.6% |
| Interquartile 25% (IQ1) | 4.6% | 4.9% |
| Interquartile 75% (IQ3) | 8.2% | 12.0% |
| Interquartile Range (IQR) | 3.6% | 7.1% |
| Standard Deviation (Sample) | 2.5% | 8.5% |
| Standard Deviation (Population) | 2.5% | 8.3% |
Similar Demographics by Unemployment Among Ages 30 to 34 years
Demographics Similar to Immigrants from Caribbean by Unemployment Among Ages 30 to 34 years
In terms of unemployment among ages 30 to 34 years, the demographic groups most similar to Immigrants from Caribbean are Cherokee (6.4%, a difference of 0.32%), Cree (6.4%, a difference of 0.37%), African (6.4%, a difference of 0.37%), Hispanic or Latino (6.4%, a difference of 0.40%), and Immigrants from Bangladesh (6.4%, a difference of 0.47%).
| Demographics | Rating | Rank | Unemployment Among Ages 30 to 34 years |
| U.S. Virgin Islanders | 0.0 /100 | #274 | Tragic 6.3% |
| Ecuadorians | 0.0 /100 | #275 | Tragic 6.3% |
| Pennsylvania Germans | 0.0 /100 | #276 | Tragic 6.3% |
| Immigrants | Ecuador | 0.0 /100 | #277 | Tragic 6.3% |
| Osage | 0.0 /100 | #278 | Tragic 6.3% |
| Cree | 0.0 /100 | #279 | Tragic 6.4% |
| Cherokee | 0.0 /100 | #280 | Tragic 6.4% |
| Immigrants | Caribbean | 0.0 /100 | #281 | Tragic 6.4% |
| Africans | 0.0 /100 | #282 | Tragic 6.4% |
| Hispanics or Latinos | 0.0 /100 | #283 | Tragic 6.4% |
| Immigrants | Bangladesh | 0.0 /100 | #284 | Tragic 6.4% |
| Choctaw | 0.0 /100 | #285 | Tragic 6.4% |
| Central American Indians | 0.0 /100 | #286 | Tragic 6.4% |
| Immigrants | West Indies | 0.0 /100 | #287 | Tragic 6.4% |
| Senegalese | 0.0 /100 | #288 | Tragic 6.4% |
Demographics Similar to Immigrants from Netherlands by Unemployment Among Ages 30 to 34 years
In terms of unemployment among ages 30 to 34 years, the demographic groups most similar to Immigrants from Netherlands are Romanian (5.3%, a difference of 0.050%), Immigrants from Poland (5.3%, a difference of 0.070%), New Zealander (5.3%, a difference of 0.080%), Immigrants from Italy (5.3%, a difference of 0.090%), and Immigrants from Brazil (5.3%, a difference of 0.12%).
| Demographics | Rating | Rank | Unemployment Among Ages 30 to 34 years |
| Immigrants | Albania | 83.4 /100 | #115 | Excellent 5.3% |
| Eastern Europeans | 83.2 /100 | #116 | Excellent 5.3% |
| Australians | 83.1 /100 | #117 | Excellent 5.3% |
| Immigrants | South Africa | 83.0 /100 | #118 | Excellent 5.3% |
| New Zealanders | 82.5 /100 | #119 | Excellent 5.3% |
| Immigrants | Poland | 82.4 /100 | #120 | Excellent 5.3% |
| Romanians | 82.3 /100 | #121 | Excellent 5.3% |
| Immigrants | Netherlands | 81.8 /100 | #122 | Excellent 5.3% |
| Immigrants | Italy | 81.1 /100 | #123 | Excellent 5.3% |
| Immigrants | Brazil | 80.8 /100 | #124 | Excellent 5.3% |
| Greeks | 80.4 /100 | #125 | Excellent 5.3% |
| Immigrants | Sri Lanka | 80.2 /100 | #126 | Excellent 5.3% |
| Taiwanese | 79.4 /100 | #127 | Good 5.3% |
| Immigrants | Uruguay | 79.3 /100 | #128 | Good 5.3% |
| Poles | 78.8 /100 | #129 | Good 5.3% |