Immigrants from Nigeria vs Burmese Unemployment Among Women with Children Under 6 years
COMPARE
Immigrants from Nigeria
Burmese
Unemployment Among Women with Children Under 6 years
Unemployment Among Women with Children Under 6 years Comparison
Immigrants from Nigeria
Burmese
7.9%
UNEMPLOYMENT AMONG WOMEN WITH CHILDREN UNDER 6 YEARS
10.3/ 100
METRIC RATING
217th/ 347
METRIC RANK
6.5%
UNEMPLOYMENT AMONG WOMEN WITH CHILDREN UNDER 6 YEARS
100.0/ 100
METRIC RATING
21st/ 347
METRIC RANK
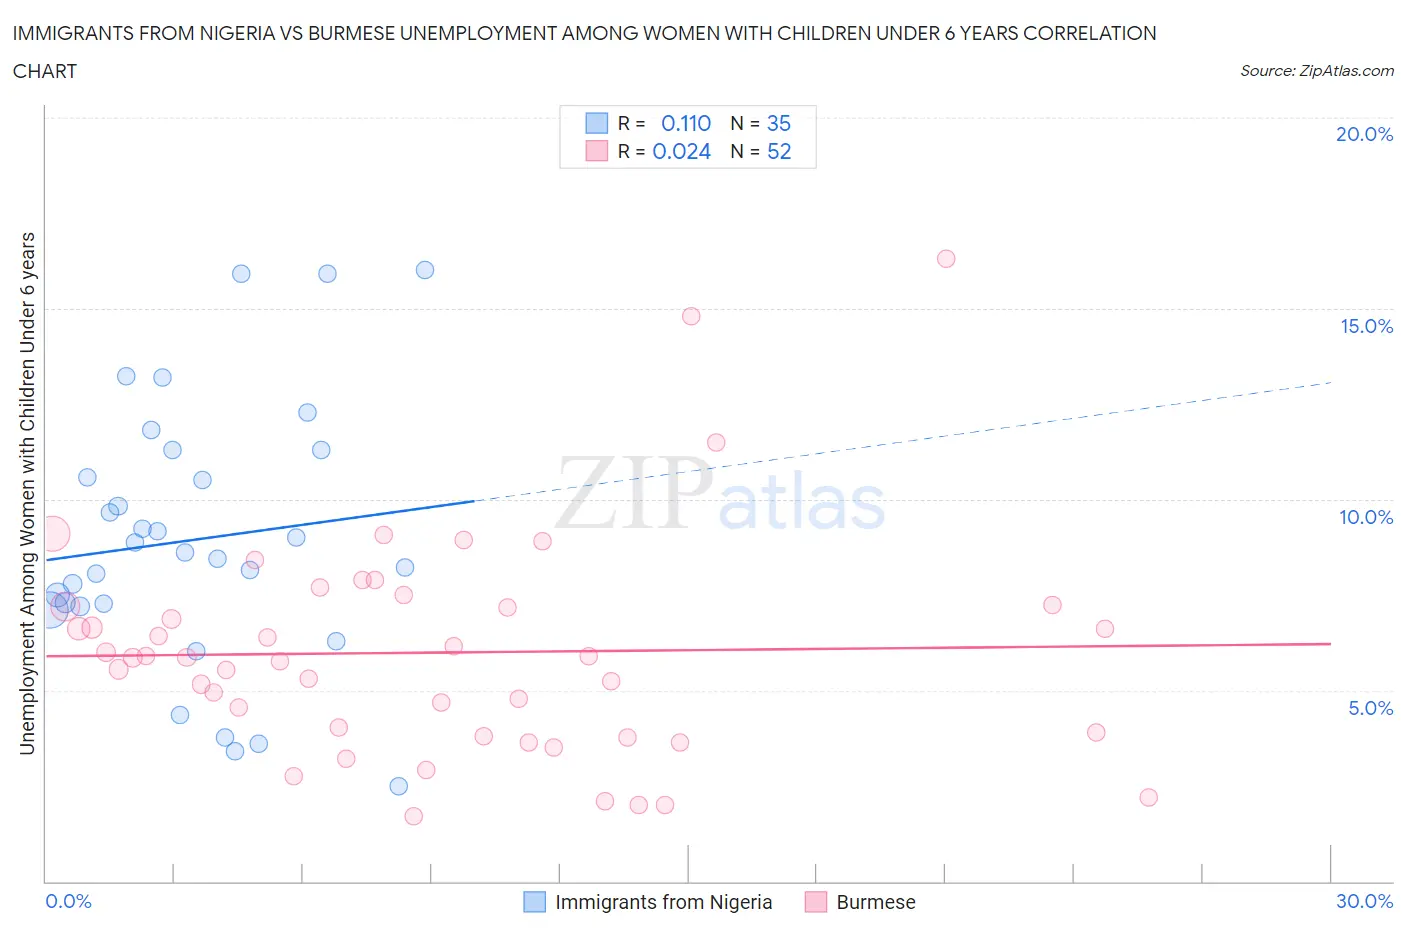
Immigrants from Nigeria vs Burmese Unemployment Among Women with Children Under 6 years Correlation Chart
The statistical analysis conducted on geographies consisting of 235,747,701 people shows a poor positive correlation between the proportion of Immigrants from Nigeria and unemployment rate among women with children under the age of 6 in the United States with a correlation coefficient (R) of 0.110 and weighted average of 7.9%. Similarly, the statistical analysis conducted on geographies consisting of 339,459,129 people shows no correlation between the proportion of Burmese and unemployment rate among women with children under the age of 6 in the United States with a correlation coefficient (R) of 0.024 and weighted average of 6.5%, a difference of 22.2%.
Unemployment Among Women with Children Under 6 years Correlation Summary
| Measurement | Immigrants from Nigeria | Burmese |
| Minimum | 2.5% | 1.7% |
| Maximum | 16.0% | 16.3% |
| Range | 13.5% | 14.6% |
| Mean | 9.0% | 6.0% |
| Median | 8.6% | 5.9% |
| Interquartile 25% (IQ1) | 7.2% | 3.8% |
| Interquartile 75% (IQ3) | 11.3% | 7.2% |
| Interquartile Range (IQR) | 4.1% | 3.4% |
| Standard Deviation (Sample) | 3.4% | 2.9% |
| Standard Deviation (Population) | 3.4% | 2.9% |
Similar Demographics by Unemployment Among Women with Children Under 6 years
Demographics Similar to Immigrants from Nigeria by Unemployment Among Women with Children Under 6 years
In terms of unemployment among women with children under 6 years, the demographic groups most similar to Immigrants from Nigeria are Moroccan (7.9%, a difference of 0.11%), Immigrants from Lebanon (7.9%, a difference of 0.12%), Ecuadorian (7.9%, a difference of 0.14%), Spanish (7.9%, a difference of 0.15%), and Scottish (7.9%, a difference of 0.17%).
| Demographics | Rating | Rank | Unemployment Among Women with Children Under 6 years |
| Poles | 16.0 /100 | #210 | Poor 7.9% |
| Immigrants | Ecuador | 14.9 /100 | #211 | Poor 7.9% |
| Swiss | 12.3 /100 | #212 | Poor 7.9% |
| Scottish | 11.4 /100 | #213 | Poor 7.9% |
| Spanish | 11.3 /100 | #214 | Poor 7.9% |
| Ecuadorians | 11.2 /100 | #215 | Poor 7.9% |
| Immigrants | Lebanon | 11.1 /100 | #216 | Poor 7.9% |
| Immigrants | Nigeria | 10.3 /100 | #217 | Poor 7.9% |
| Moroccans | 9.7 /100 | #218 | Tragic 7.9% |
| Arabs | 9.4 /100 | #219 | Tragic 7.9% |
| South American Indians | 9.3 /100 | #220 | Tragic 7.9% |
| Immigrants | Germany | 8.5 /100 | #221 | Tragic 7.9% |
| Samoans | 8.4 /100 | #222 | Tragic 7.9% |
| Carpatho Rusyns | 7.8 /100 | #223 | Tragic 8.0% |
| English | 7.2 /100 | #224 | Tragic 8.0% |
Demographics Similar to Burmese by Unemployment Among Women with Children Under 6 years
In terms of unemployment among women with children under 6 years, the demographic groups most similar to Burmese are Ute (6.5%, a difference of 0.050%), Mongolian (6.5%, a difference of 0.10%), Immigrants from Korea (6.5%, a difference of 0.42%), Assyrian/Chaldean/Syriac (6.5%, a difference of 0.43%), and Bulgarian (6.5%, a difference of 0.62%).
| Demographics | Rating | Rank | Unemployment Among Women with Children Under 6 years |
| Immigrants | Bulgaria | 100.0 /100 | #14 | Exceptional 6.3% |
| Thais | 100.0 /100 | #15 | Exceptional 6.3% |
| Immigrants | Uzbekistan | 100.0 /100 | #16 | Exceptional 6.3% |
| Immigrants | Malaysia | 100.0 /100 | #17 | Exceptional 6.4% |
| Assyrians/Chaldeans/Syriacs | 100.0 /100 | #18 | Exceptional 6.5% |
| Mongolians | 100.0 /100 | #19 | Exceptional 6.5% |
| Ute | 100.0 /100 | #20 | Exceptional 6.5% |
| Burmese | 100.0 /100 | #21 | Exceptional 6.5% |
| Immigrants | Korea | 100.0 /100 | #22 | Exceptional 6.5% |
| Bulgarians | 100.0 /100 | #23 | Exceptional 6.5% |
| Laotians | 100.0 /100 | #24 | Exceptional 6.5% |
| Soviet Union | 100.0 /100 | #25 | Exceptional 6.5% |
| Cypriots | 100.0 /100 | #26 | Exceptional 6.5% |
| Immigrants | Japan | 100.0 /100 | #27 | Exceptional 6.5% |
| Immigrants | Israel | 100.0 /100 | #28 | Exceptional 6.5% |