Immigrants from Czechoslovakia vs Cypriot Male Unemployment
COMPARE
Immigrants from Czechoslovakia
Cypriot
Male Unemployment
Male Unemployment Comparison
Immigrants from Czechoslovakia
Cypriots
5.1%
MALE UNEMPLOYMENT
91.7/ 100
METRIC RATING
105th/ 347
METRIC RANK
5.1%
MALE UNEMPLOYMENT
88.8/ 100
METRIC RATING
118th/ 347
METRIC RANK
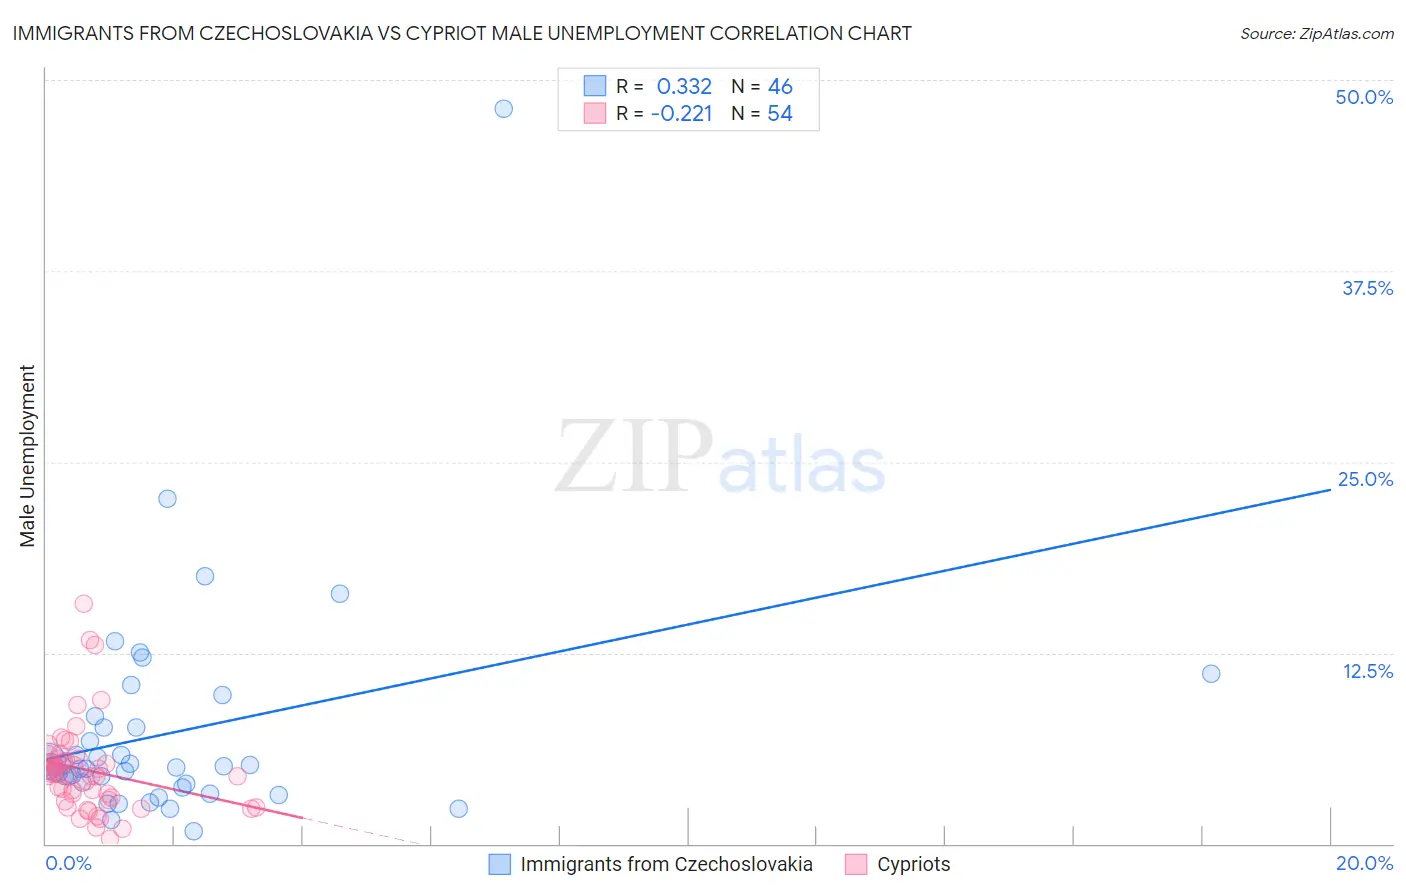
Immigrants from Czechoslovakia vs Cypriot Male Unemployment Correlation Chart
The statistical analysis conducted on geographies consisting of 195,196,064 people shows a mild positive correlation between the proportion of Immigrants from Czechoslovakia and unemployment rate among males in the United States with a correlation coefficient (R) of 0.332 and weighted average of 5.1%. Similarly, the statistical analysis conducted on geographies consisting of 61,847,118 people shows a weak negative correlation between the proportion of Cypriots and unemployment rate among males in the United States with a correlation coefficient (R) of -0.221 and weighted average of 5.1%, a difference of 0.49%.
Male Unemployment Correlation Summary
| Measurement | Immigrants from Czechoslovakia | Cypriot |
| Minimum | 0.80% | 0.30% |
| Maximum | 48.1% | 15.7% |
| Range | 47.3% | 15.4% |
| Mean | 7.3% | 4.8% |
| Median | 5.0% | 4.5% |
| Interquartile 25% (IQ1) | 3.9% | 2.9% |
| Interquartile 75% (IQ3) | 7.6% | 5.6% |
| Interquartile Range (IQR) | 3.7% | 2.7% |
| Standard Deviation (Sample) | 7.6% | 3.0% |
| Standard Deviation (Population) | 7.5% | 2.9% |
Demographics Similar to Immigrants from Czechoslovakia and Cypriots by Male Unemployment
In terms of male unemployment, the demographic groups most similar to Immigrants from Czechoslovakia are Immigrants from Chile (5.1%, a difference of 0.010%), Immigrants from Jordan (5.1%, a difference of 0.040%), Immigrants from Ethiopia (5.1%, a difference of 0.040%), Ethiopian (5.1%, a difference of 0.080%), and Immigrants from Nicaragua (5.1%, a difference of 0.090%). Similarly, the demographic groups most similar to Cypriots are Estonian (5.1%, a difference of 0.030%), French Canadian (5.1%, a difference of 0.040%), Ukrainian (5.1%, a difference of 0.060%), Mongolian (5.1%, a difference of 0.070%), and Immigrants from Denmark (5.1%, a difference of 0.080%).
| Demographics | Rating | Rank | Male Unemployment |
| German Russians | 92.7 /100 | #101 | Exceptional 5.1% |
| Immigrants | France | 92.7 /100 | #102 | Exceptional 5.1% |
| Immigrants | Jordan | 91.9 /100 | #103 | Exceptional 5.1% |
| Immigrants | Chile | 91.8 /100 | #104 | Exceptional 5.1% |
| Immigrants | Czechoslovakia | 91.7 /100 | #105 | Exceptional 5.1% |
| Immigrants | Ethiopia | 91.5 /100 | #106 | Exceptional 5.1% |
| Ethiopians | 91.3 /100 | #107 | Exceptional 5.1% |
| Immigrants | Nicaragua | 91.2 /100 | #108 | Exceptional 5.1% |
| Immigrants | Pakistan | 90.9 /100 | #109 | Exceptional 5.1% |
| Immigrants | England | 90.8 /100 | #110 | Exceptional 5.1% |
| Immigrants | Eastern Asia | 90.8 /100 | #111 | Exceptional 5.1% |
| Immigrants | Moldova | 90.3 /100 | #112 | Exceptional 5.1% |
| Immigrants | Austria | 90.3 /100 | #113 | Exceptional 5.1% |
| Romanians | 89.8 /100 | #114 | Excellent 5.1% |
| Immigrants | Asia | 89.6 /100 | #115 | Excellent 5.1% |
| Immigrants | Denmark | 89.4 /100 | #116 | Excellent 5.1% |
| Estonians | 89.0 /100 | #117 | Excellent 5.1% |
| Cypriots | 88.8 /100 | #118 | Excellent 5.1% |
| French Canadians | 88.6 /100 | #119 | Excellent 5.1% |
| Ukrainians | 88.4 /100 | #120 | Excellent 5.1% |
| Mongolians | 88.4 /100 | #121 | Excellent 5.1% |