Bahamian vs Cypriot Male Unemployment
COMPARE
Bahamian
Cypriot
Male Unemployment
Male Unemployment Comparison
Bahamians
Cypriots
5.9%
MALE UNEMPLOYMENT
0.0/ 100
METRIC RATING
266th/ 347
METRIC RANK
5.1%
MALE UNEMPLOYMENT
88.8/ 100
METRIC RATING
118th/ 347
METRIC RANK
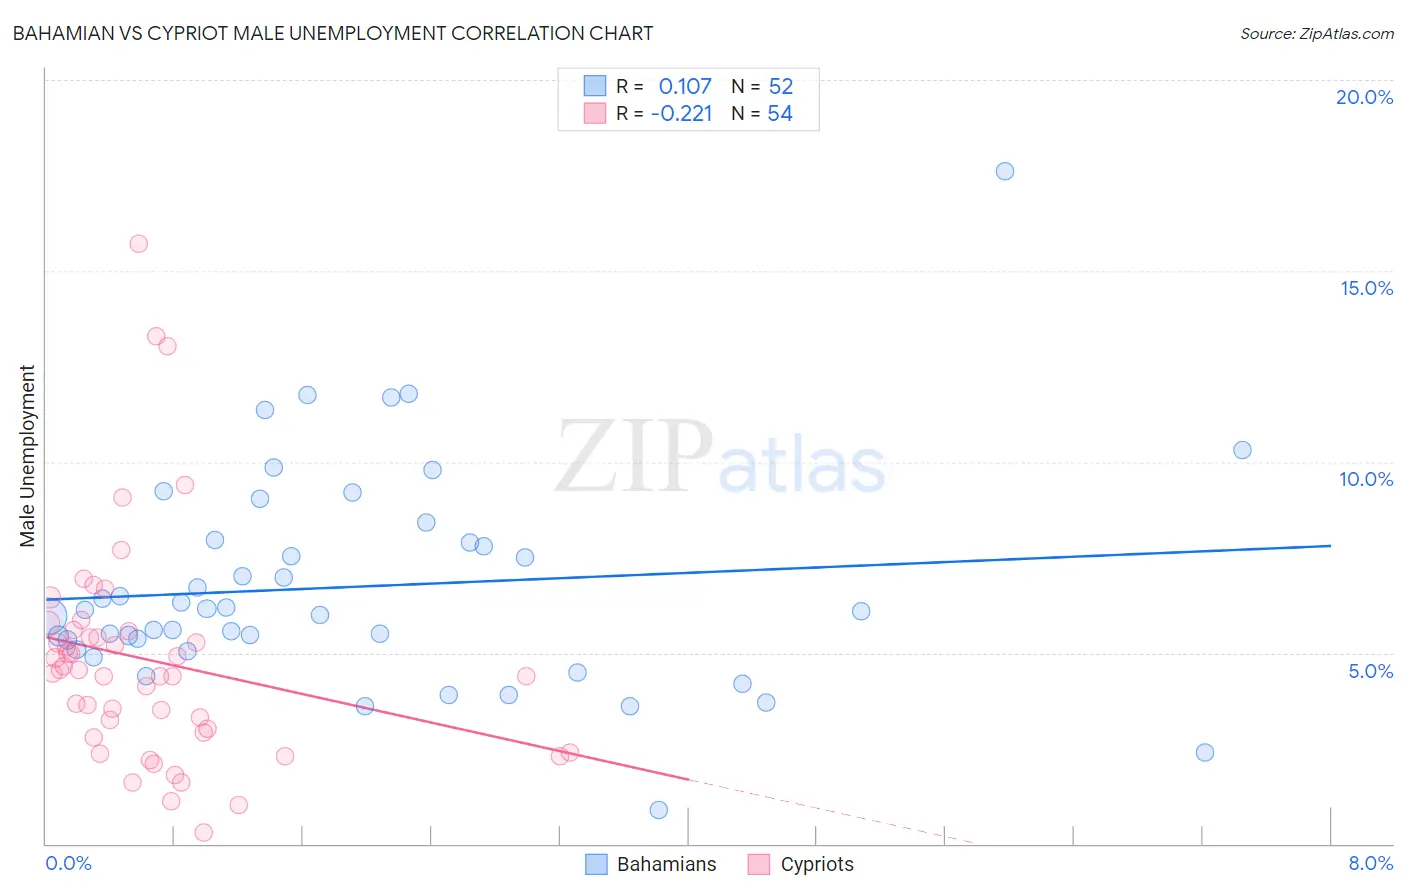
Bahamian vs Cypriot Male Unemployment Correlation Chart
The statistical analysis conducted on geographies consisting of 112,565,011 people shows a poor positive correlation between the proportion of Bahamians and unemployment rate among males in the United States with a correlation coefficient (R) of 0.107 and weighted average of 5.9%. Similarly, the statistical analysis conducted on geographies consisting of 61,847,118 people shows a weak negative correlation between the proportion of Cypriots and unemployment rate among males in the United States with a correlation coefficient (R) of -0.221 and weighted average of 5.1%, a difference of 15.2%.
Male Unemployment Correlation Summary
| Measurement | Bahamian | Cypriot |
| Minimum | 0.90% | 0.30% |
| Maximum | 17.6% | 15.7% |
| Range | 16.7% | 15.4% |
| Mean | 6.7% | 4.8% |
| Median | 6.1% | 4.5% |
| Interquartile 25% (IQ1) | 5.2% | 2.9% |
| Interquartile 75% (IQ3) | 7.9% | 5.6% |
| Interquartile Range (IQR) | 2.7% | 2.7% |
| Standard Deviation (Sample) | 2.9% | 3.0% |
| Standard Deviation (Population) | 2.8% | 2.9% |
Similar Demographics by Male Unemployment
Demographics Similar to Bahamians by Male Unemployment
In terms of male unemployment, the demographic groups most similar to Bahamians are Nigerian (5.9%, a difference of 0.12%), French American Indian (5.9%, a difference of 0.14%), Bermudan (5.9%, a difference of 0.33%), Immigrants from Mexico (5.9%, a difference of 0.52%), and Immigrants from Nigeria (6.0%, a difference of 0.60%).
| Demographics | Rating | Rank | Male Unemployment |
| Cajuns | 0.1 /100 | #259 | Tragic 5.8% |
| Immigrants | Central America | 0.1 /100 | #260 | Tragic 5.8% |
| Liberians | 0.1 /100 | #261 | Tragic 5.8% |
| Immigrants | Portugal | 0.1 /100 | #262 | Tragic 5.9% |
| Immigrants | Latin America | 0.1 /100 | #263 | Tragic 5.9% |
| Immigrants | Mexico | 0.0 /100 | #264 | Tragic 5.9% |
| French American Indians | 0.0 /100 | #265 | Tragic 5.9% |
| Bahamians | 0.0 /100 | #266 | Tragic 5.9% |
| Nigerians | 0.0 /100 | #267 | Tragic 5.9% |
| Bermudans | 0.0 /100 | #268 | Tragic 5.9% |
| Immigrants | Nigeria | 0.0 /100 | #269 | Tragic 6.0% |
| Sub-Saharan Africans | 0.0 /100 | #270 | Tragic 6.0% |
| Blackfeet | 0.0 /100 | #271 | Tragic 6.0% |
| Immigrants | Uzbekistan | 0.0 /100 | #272 | Tragic 6.0% |
| Armenians | 0.0 /100 | #273 | Tragic 6.0% |
Demographics Similar to Cypriots by Male Unemployment
In terms of male unemployment, the demographic groups most similar to Cypriots are Estonian (5.1%, a difference of 0.030%), French Canadian (5.1%, a difference of 0.040%), Ukrainian (5.1%, a difference of 0.060%), Mongolian (5.1%, a difference of 0.070%), and Immigrants from Denmark (5.1%, a difference of 0.080%).
| Demographics | Rating | Rank | Male Unemployment |
| Immigrants | Eastern Asia | 90.8 /100 | #111 | Exceptional 5.1% |
| Immigrants | Moldova | 90.3 /100 | #112 | Exceptional 5.1% |
| Immigrants | Austria | 90.3 /100 | #113 | Exceptional 5.1% |
| Romanians | 89.8 /100 | #114 | Excellent 5.1% |
| Immigrants | Asia | 89.6 /100 | #115 | Excellent 5.1% |
| Immigrants | Denmark | 89.4 /100 | #116 | Excellent 5.1% |
| Estonians | 89.0 /100 | #117 | Excellent 5.1% |
| Cypriots | 88.8 /100 | #118 | Excellent 5.1% |
| French Canadians | 88.6 /100 | #119 | Excellent 5.1% |
| Ukrainians | 88.4 /100 | #120 | Excellent 5.1% |
| Mongolians | 88.4 /100 | #121 | Excellent 5.1% |
| Nicaraguans | 88.2 /100 | #122 | Excellent 5.1% |
| Palestinians | 87.7 /100 | #123 | Excellent 5.1% |
| Immigrants | Latvia | 87.5 /100 | #124 | Excellent 5.1% |
| Immigrants | Lithuania | 87.2 /100 | #125 | Excellent 5.1% |