Immigrants from Nigeria vs Ecuadorian Unemployment Among Ages 45 to 54 years
COMPARE
Immigrants from Nigeria
Ecuadorian
Unemployment Among Ages 45 to 54 years
Unemployment Among Ages 45 to 54 years Comparison
Immigrants from Nigeria
Ecuadorians
4.6%
UNEMPLOYMENT AMONG AGES 45 TO 54 YEARS
13.3/ 100
METRIC RATING
209th/ 347
METRIC RANK
5.3%
UNEMPLOYMENT AMONG AGES 45 TO 54 YEARS
0.0/ 100
METRIC RATING
299th/ 347
METRIC RANK
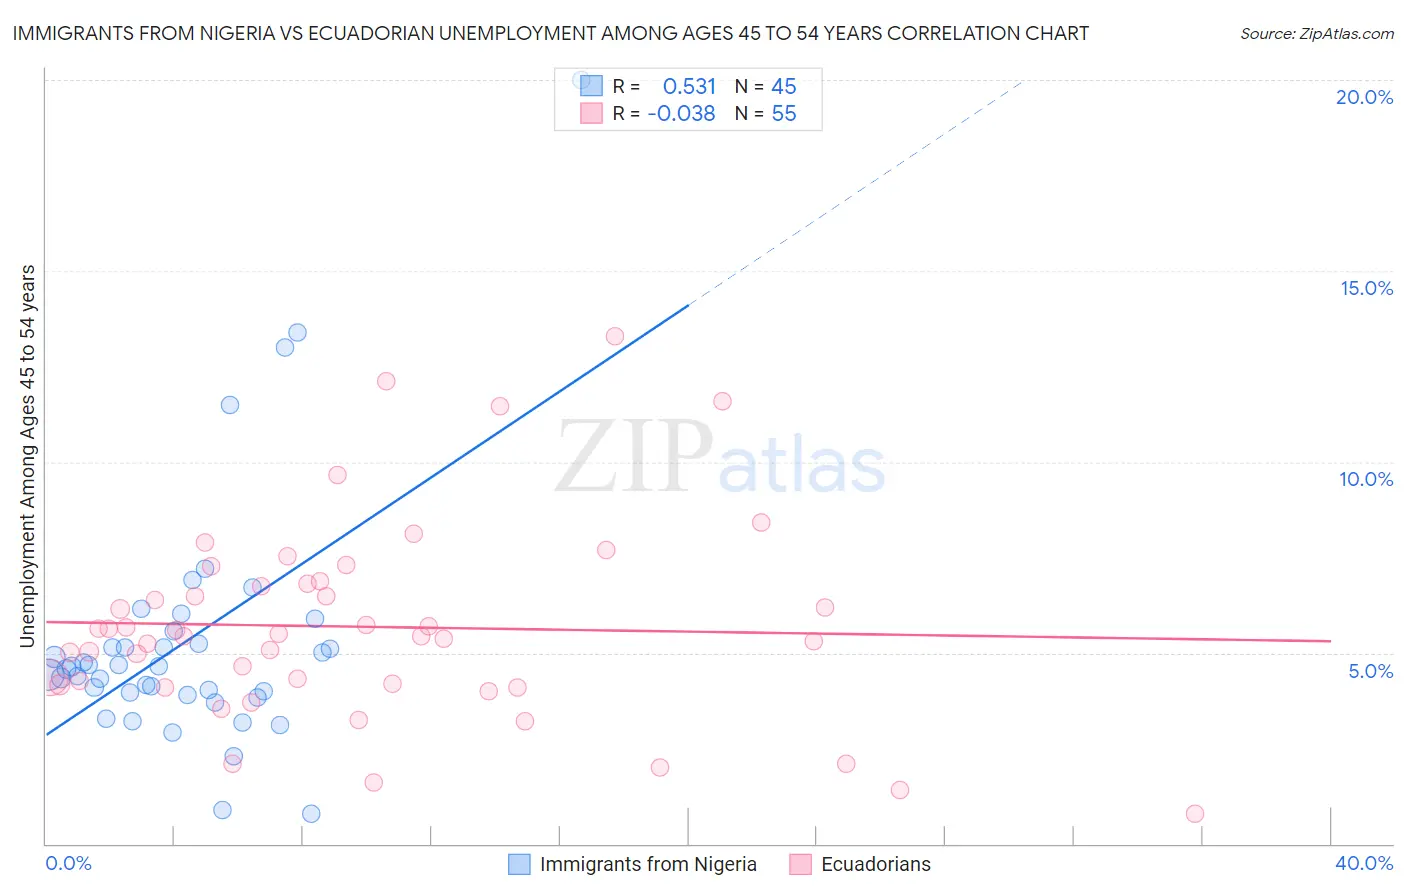
Immigrants from Nigeria vs Ecuadorian Unemployment Among Ages 45 to 54 years Correlation Chart
The statistical analysis conducted on geographies consisting of 279,785,103 people shows a substantial positive correlation between the proportion of Immigrants from Nigeria and unemployment rate among population between the ages 45 and 54 in the United States with a correlation coefficient (R) of 0.531 and weighted average of 4.6%. Similarly, the statistical analysis conducted on geographies consisting of 312,530,580 people shows no correlation between the proportion of Ecuadorians and unemployment rate among population between the ages 45 and 54 in the United States with a correlation coefficient (R) of -0.038 and weighted average of 5.3%, a difference of 14.1%.
Unemployment Among Ages 45 to 54 years Correlation Summary
| Measurement | Immigrants from Nigeria | Ecuadorian |
| Minimum | 0.80% | 0.80% |
| Maximum | 20.0% | 13.3% |
| Range | 19.2% | 12.5% |
| Mean | 5.3% | 5.7% |
| Median | 4.6% | 5.4% |
| Interquartile 25% (IQ1) | 3.9% | 4.2% |
| Interquartile 75% (IQ3) | 5.4% | 6.8% |
| Interquartile Range (IQR) | 1.5% | 2.6% |
| Standard Deviation (Sample) | 3.3% | 2.6% |
| Standard Deviation (Population) | 3.3% | 2.6% |
Similar Demographics by Unemployment Among Ages 45 to 54 years
Demographics Similar to Immigrants from Nigeria by Unemployment Among Ages 45 to 54 years
In terms of unemployment among ages 45 to 54 years, the demographic groups most similar to Immigrants from Nigeria are Immigrants from Africa (4.6%, a difference of 0.030%), Arab (4.6%, a difference of 0.050%), Immigrants from Switzerland (4.6%, a difference of 0.070%), Immigrants from South America (4.6%, a difference of 0.11%), and Creek (4.6%, a difference of 0.14%).
| Demographics | Rating | Rank | Unemployment Among Ages 45 to 54 years |
| Immigrants | Peru | 19.1 /100 | #202 | Poor 4.6% |
| Liberians | 18.7 /100 | #203 | Poor 4.6% |
| Immigrants | Morocco | 16.8 /100 | #204 | Poor 4.6% |
| Immigrants | Greece | 16.2 /100 | #205 | Poor 4.6% |
| Immigrants | Switzerland | 14.0 /100 | #206 | Poor 4.6% |
| Arabs | 13.7 /100 | #207 | Poor 4.6% |
| Immigrants | Africa | 13.6 /100 | #208 | Poor 4.6% |
| Immigrants | Nigeria | 13.3 /100 | #209 | Poor 4.6% |
| Immigrants | South America | 12.2 /100 | #210 | Poor 4.6% |
| Creek | 11.9 /100 | #211 | Poor 4.6% |
| Immigrants | Iran | 11.5 /100 | #212 | Poor 4.6% |
| Panamanians | 10.7 /100 | #213 | Poor 4.6% |
| Cherokee | 10.6 /100 | #214 | Poor 4.6% |
| Immigrants | Panama | 10.4 /100 | #215 | Poor 4.6% |
| Lumbee | 9.2 /100 | #216 | Tragic 4.6% |
Demographics Similar to Ecuadorians by Unemployment Among Ages 45 to 54 years
In terms of unemployment among ages 45 to 54 years, the demographic groups most similar to Ecuadorians are Immigrants from Trinidad and Tobago (5.3%, a difference of 0.020%), Aleut (5.3%, a difference of 0.14%), West Indian (5.3%, a difference of 0.14%), Central American Indian (5.3%, a difference of 0.21%), and Jamaican (5.3%, a difference of 0.33%).
| Demographics | Rating | Rank | Unemployment Among Ages 45 to 54 years |
| Trinidadians and Tobagonians | 0.0 /100 | #292 | Tragic 5.2% |
| Immigrants | Senegal | 0.0 /100 | #293 | Tragic 5.2% |
| Belizeans | 0.0 /100 | #294 | Tragic 5.2% |
| Jamaicans | 0.0 /100 | #295 | Tragic 5.3% |
| Aleuts | 0.0 /100 | #296 | Tragic 5.3% |
| West Indians | 0.0 /100 | #297 | Tragic 5.3% |
| Immigrants | Trinidad and Tobago | 0.0 /100 | #298 | Tragic 5.3% |
| Ecuadorians | 0.0 /100 | #299 | Tragic 5.3% |
| Central American Indians | 0.0 /100 | #300 | Tragic 5.3% |
| Menominee | 0.0 /100 | #301 | Tragic 5.3% |
| Immigrants | Ecuador | 0.0 /100 | #302 | Tragic 5.3% |
| Immigrants | Belize | 0.0 /100 | #303 | Tragic 5.3% |
| Immigrants | Jamaica | 0.0 /100 | #304 | Tragic 5.4% |
| Immigrants | West Indies | 0.0 /100 | #305 | Tragic 5.4% |
| Immigrants | Bangladesh | 0.0 /100 | #306 | Tragic 5.4% |