Immigrants from Netherlands vs Argentinean Unemployment Among Women with Children Ages 6 to 17 years
COMPARE
Immigrants from Netherlands
Argentinean
Unemployment Among Women with Children Ages 6 to 17 years
Unemployment Among Women with Children Ages 6 to 17 years Comparison
Immigrants from Netherlands
Argentineans
8.9%
UNEMPLOYMENT AMONG WOMEN WITH CHILDREN AGES 6 TO 17 YEARS
60.8/ 100
METRIC RATING
162nd/ 347
METRIC RANK
8.6%
UNEMPLOYMENT AMONG WOMEN WITH CHILDREN AGES 6 TO 17 YEARS
96.5/ 100
METRIC RATING
115th/ 347
METRIC RANK
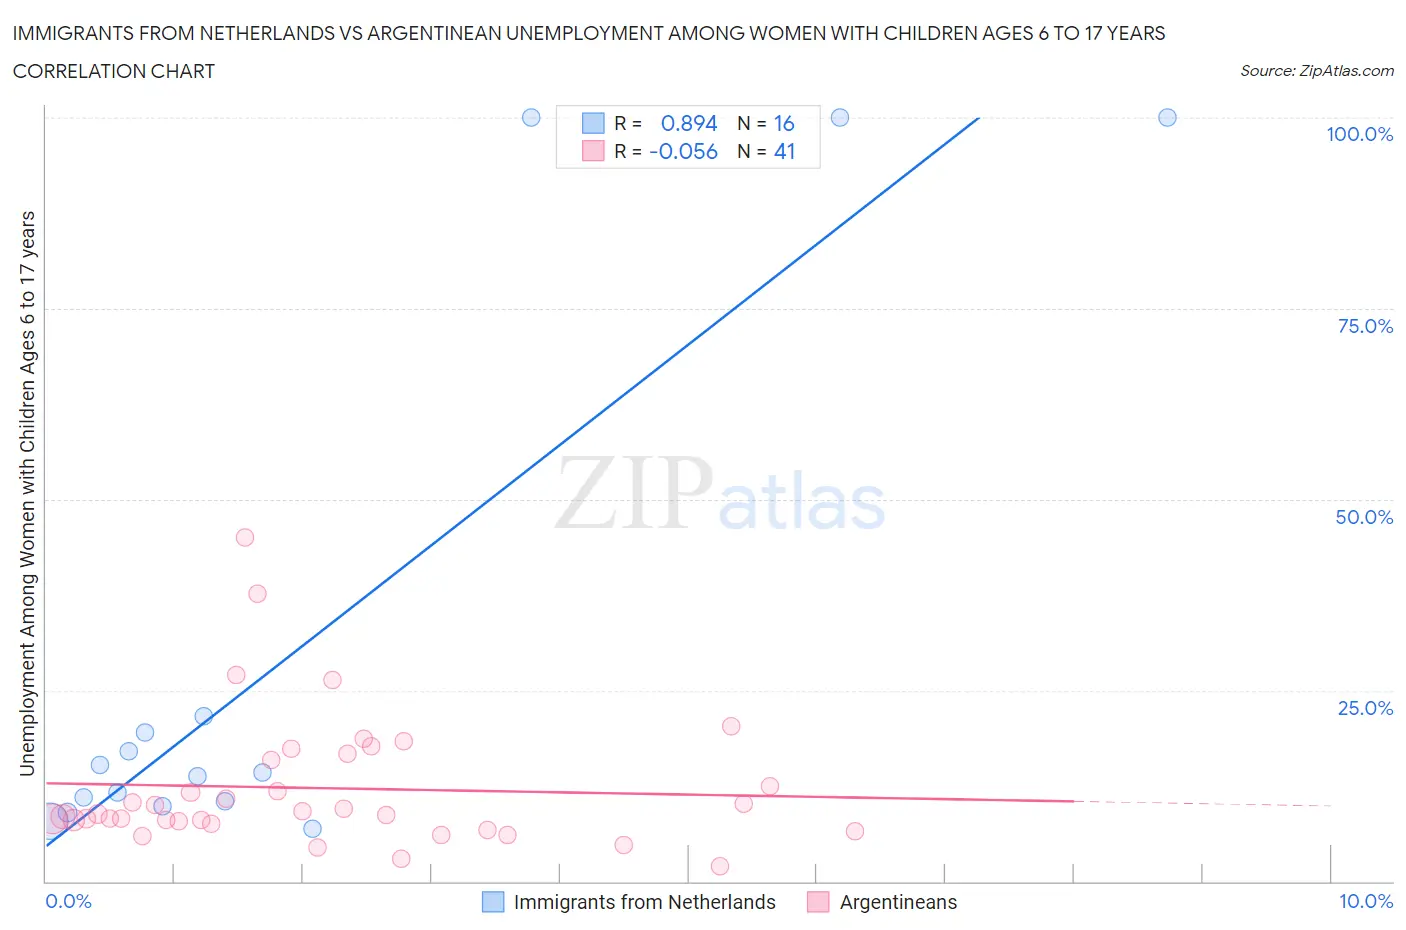
Immigrants from Netherlands vs Argentinean Unemployment Among Women with Children Ages 6 to 17 years Correlation Chart
The statistical analysis conducted on geographies consisting of 182,415,799 people shows a very strong positive correlation between the proportion of Immigrants from Netherlands and unemployment rate among women with children between the ages 6 and 17 in the United States with a correlation coefficient (R) of 0.894 and weighted average of 8.9%. Similarly, the statistical analysis conducted on geographies consisting of 227,377,871 people shows a slight negative correlation between the proportion of Argentineans and unemployment rate among women with children between the ages 6 and 17 in the United States with a correlation coefficient (R) of -0.056 and weighted average of 8.6%, a difference of 3.3%.
Unemployment Among Women with Children Ages 6 to 17 years Correlation Summary
| Measurement | Immigrants from Netherlands | Argentinean |
| Minimum | 6.8% | 2.0% |
| Maximum | 100.0% | 45.0% |
| Range | 93.2% | 43.0% |
| Mean | 29.2% | 12.2% |
| Median | 14.0% | 8.8% |
| Interquartile 25% (IQ1) | 10.1% | 7.6% |
| Interquartile 75% (IQ3) | 20.6% | 16.3% |
| Interquartile Range (IQR) | 10.4% | 8.6% |
| Standard Deviation (Sample) | 35.3% | 8.8% |
| Standard Deviation (Population) | 34.2% | 8.7% |
Similar Demographics by Unemployment Among Women with Children Ages 6 to 17 years
Demographics Similar to Immigrants from Netherlands by Unemployment Among Women with Children Ages 6 to 17 years
In terms of unemployment among women with children ages 6 to 17 years, the demographic groups most similar to Immigrants from Netherlands are Mexican American Indian (8.9%, a difference of 0.010%), Ukrainian (8.9%, a difference of 0.050%), Immigrants from Micronesia (8.9%, a difference of 0.070%), Immigrants from Guyana (8.9%, a difference of 0.10%), and Moroccan (8.9%, a difference of 0.11%).
| Demographics | Rating | Rank | Unemployment Among Women with Children Ages 6 to 17 years |
| Immigrants | Greece | 71.8 /100 | #155 | Good 8.9% |
| Osage | 65.9 /100 | #156 | Good 8.9% |
| Immigrants | Belgium | 65.6 /100 | #157 | Good 8.9% |
| Immigrants | Chile | 65.3 /100 | #158 | Good 8.9% |
| Spanish | 63.8 /100 | #159 | Good 8.9% |
| Immigrants | Hungary | 63.4 /100 | #160 | Good 8.9% |
| Immigrants | Guyana | 63.0 /100 | #161 | Good 8.9% |
| Immigrants | Netherlands | 60.8 /100 | #162 | Good 8.9% |
| Mexican American Indians | 60.6 /100 | #163 | Good 8.9% |
| Ukrainians | 59.7 /100 | #164 | Average 8.9% |
| Immigrants | Micronesia | 59.2 /100 | #165 | Average 8.9% |
| Moroccans | 58.3 /100 | #166 | Average 8.9% |
| Immigrants | England | 57.7 /100 | #167 | Average 8.9% |
| Immigrants | Croatia | 57.1 /100 | #168 | Average 8.9% |
| British | 55.2 /100 | #169 | Average 8.9% |
Demographics Similar to Argentineans by Unemployment Among Women with Children Ages 6 to 17 years
In terms of unemployment among women with children ages 6 to 17 years, the demographic groups most similar to Argentineans are Immigrants from Russia (8.6%, a difference of 0.070%), Zimbabwean (8.6%, a difference of 0.070%), Eastern European (8.6%, a difference of 0.080%), Albanian (8.6%, a difference of 0.080%), and Pueblo (8.6%, a difference of 0.11%).
| Demographics | Rating | Rank | Unemployment Among Women with Children Ages 6 to 17 years |
| Swedes | 97.6 /100 | #108 | Exceptional 8.6% |
| Immigrants | Romania | 97.5 /100 | #109 | Exceptional 8.6% |
| Latvians | 97.4 /100 | #110 | Exceptional 8.6% |
| Immigrants | Ukraine | 97.4 /100 | #111 | Exceptional 8.6% |
| Romanians | 97.1 /100 | #112 | Exceptional 8.6% |
| Eastern Europeans | 96.8 /100 | #113 | Exceptional 8.6% |
| Immigrants | Russia | 96.7 /100 | #114 | Exceptional 8.6% |
| Argentineans | 96.5 /100 | #115 | Exceptional 8.6% |
| Zimbabweans | 96.3 /100 | #116 | Exceptional 8.6% |
| Albanians | 96.3 /100 | #117 | Exceptional 8.6% |
| Pueblo | 96.2 /100 | #118 | Exceptional 8.6% |
| Immigrants | Grenada | 96.2 /100 | #119 | Exceptional 8.6% |
| Israelis | 95.9 /100 | #120 | Exceptional 8.7% |
| Immigrants | Denmark | 95.5 /100 | #121 | Exceptional 8.7% |
| Immigrants | Egypt | 95.0 /100 | #122 | Exceptional 8.7% |