Immigrants from Netherlands vs Argentinean Median Family Income
COMPARE
Immigrants from Netherlands
Argentinean
Median Family Income
Median Family Income Comparison
Immigrants from Netherlands
Argentineans
$114,987
MEDIAN FAMILY INCOME
99.8/ 100
METRIC RATING
59th/ 347
METRIC RANK
$112,665
MEDIAN FAMILY INCOME
99.4/ 100
METRIC RATING
76th/ 347
METRIC RANK
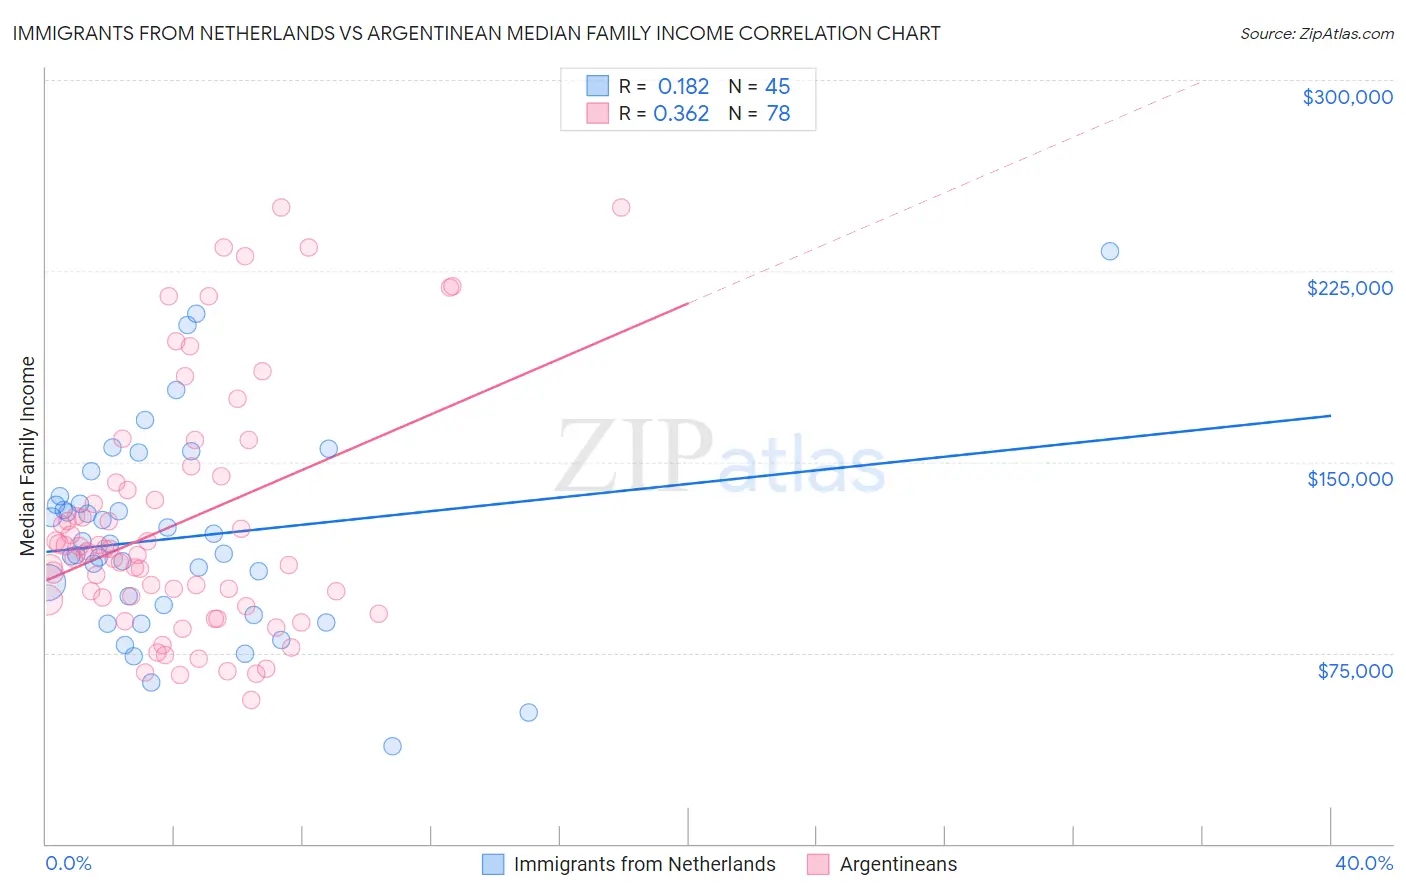
Immigrants from Netherlands vs Argentinean Median Family Income Correlation Chart
The statistical analysis conducted on geographies consisting of 237,758,558 people shows a poor positive correlation between the proportion of Immigrants from Netherlands and median family income in the United States with a correlation coefficient (R) of 0.182 and weighted average of $114,987. Similarly, the statistical analysis conducted on geographies consisting of 296,932,398 people shows a mild positive correlation between the proportion of Argentineans and median family income in the United States with a correlation coefficient (R) of 0.362 and weighted average of $112,665, a difference of 2.1%.
Median Family Income Correlation Summary
| Measurement | Immigrants from Netherlands | Argentinean |
| Minimum | $38,500 | $56,696 |
| Maximum | $232,557 | $250,001 |
| Range | $194,057 | $193,305 |
| Mean | $120,210 | $126,035 |
| Median | $117,794 | $114,562 |
| Interquartile 25% (IQ1) | $91,744 | $95,780 |
| Interquartile 75% (IQ3) | $135,100 | $141,982 |
| Interquartile Range (IQR) | $43,356 | $46,202 |
| Standard Deviation (Sample) | $39,370 | $48,159 |
| Standard Deviation (Population) | $38,930 | $47,849 |
Demographics Similar to Immigrants from Netherlands and Argentineans by Median Family Income
In terms of median family income, the demographic groups most similar to Immigrants from Netherlands are Immigrants from Latvia ($114,826, a difference of 0.14%), Immigrants from Indonesia ($115,162, a difference of 0.15%), Greek ($115,192, a difference of 0.18%), Immigrants from Belarus ($114,586, a difference of 0.35%), and Mongolian ($114,553, a difference of 0.38%). Similarly, the demographic groups most similar to Argentineans are Immigrants from Western Europe ($112,688, a difference of 0.020%), Immigrants from Eastern Europe ($112,527, a difference of 0.12%), Immigrants from Italy ($112,848, a difference of 0.16%), Laotian ($112,859, a difference of 0.17%), and Afghan ($112,971, a difference of 0.27%).
| Demographics | Rating | Rank | Median Family Income |
| Greeks | 99.8 /100 | #57 | Exceptional $115,192 |
| Immigrants | Indonesia | 99.8 /100 | #58 | Exceptional $115,162 |
| Immigrants | Netherlands | 99.8 /100 | #59 | Exceptional $114,987 |
| Immigrants | Latvia | 99.8 /100 | #60 | Exceptional $114,826 |
| Immigrants | Belarus | 99.8 /100 | #61 | Exceptional $114,586 |
| Mongolians | 99.8 /100 | #62 | Exceptional $114,553 |
| Immigrants | Pakistan | 99.8 /100 | #63 | Exceptional $114,406 |
| Immigrants | Scotland | 99.7 /100 | #64 | Exceptional $114,392 |
| Egyptians | 99.7 /100 | #65 | Exceptional $114,119 |
| Paraguayans | 99.7 /100 | #66 | Exceptional $114,016 |
| Immigrants | Spain | 99.7 /100 | #67 | Exceptional $113,815 |
| Immigrants | Serbia | 99.6 /100 | #68 | Exceptional $113,463 |
| Immigrants | Bulgaria | 99.6 /100 | #69 | Exceptional $113,461 |
| Immigrants | Romania | 99.6 /100 | #70 | Exceptional $113,434 |
| South Africans | 99.5 /100 | #71 | Exceptional $113,229 |
| Afghans | 99.5 /100 | #72 | Exceptional $112,971 |
| Laotians | 99.5 /100 | #73 | Exceptional $112,859 |
| Immigrants | Italy | 99.4 /100 | #74 | Exceptional $112,848 |
| Immigrants | Western Europe | 99.4 /100 | #75 | Exceptional $112,688 |
| Argentineans | 99.4 /100 | #76 | Exceptional $112,665 |
| Immigrants | Eastern Europe | 99.4 /100 | #77 | Exceptional $112,527 |