Immigrants from Netherlands vs Bahamian Unemployment Among Women with Children Ages 6 to 17 years
COMPARE
Immigrants from Netherlands
Bahamian
Unemployment Among Women with Children Ages 6 to 17 years
Unemployment Among Women with Children Ages 6 to 17 years Comparison
Immigrants from Netherlands
Bahamians
8.9%
UNEMPLOYMENT AMONG WOMEN WITH CHILDREN AGES 6 TO 17 YEARS
60.8/ 100
METRIC RATING
162nd/ 347
METRIC RANK
10.4%
UNEMPLOYMENT AMONG WOMEN WITH CHILDREN AGES 6 TO 17 YEARS
0.0/ 100
METRIC RATING
315th/ 347
METRIC RANK
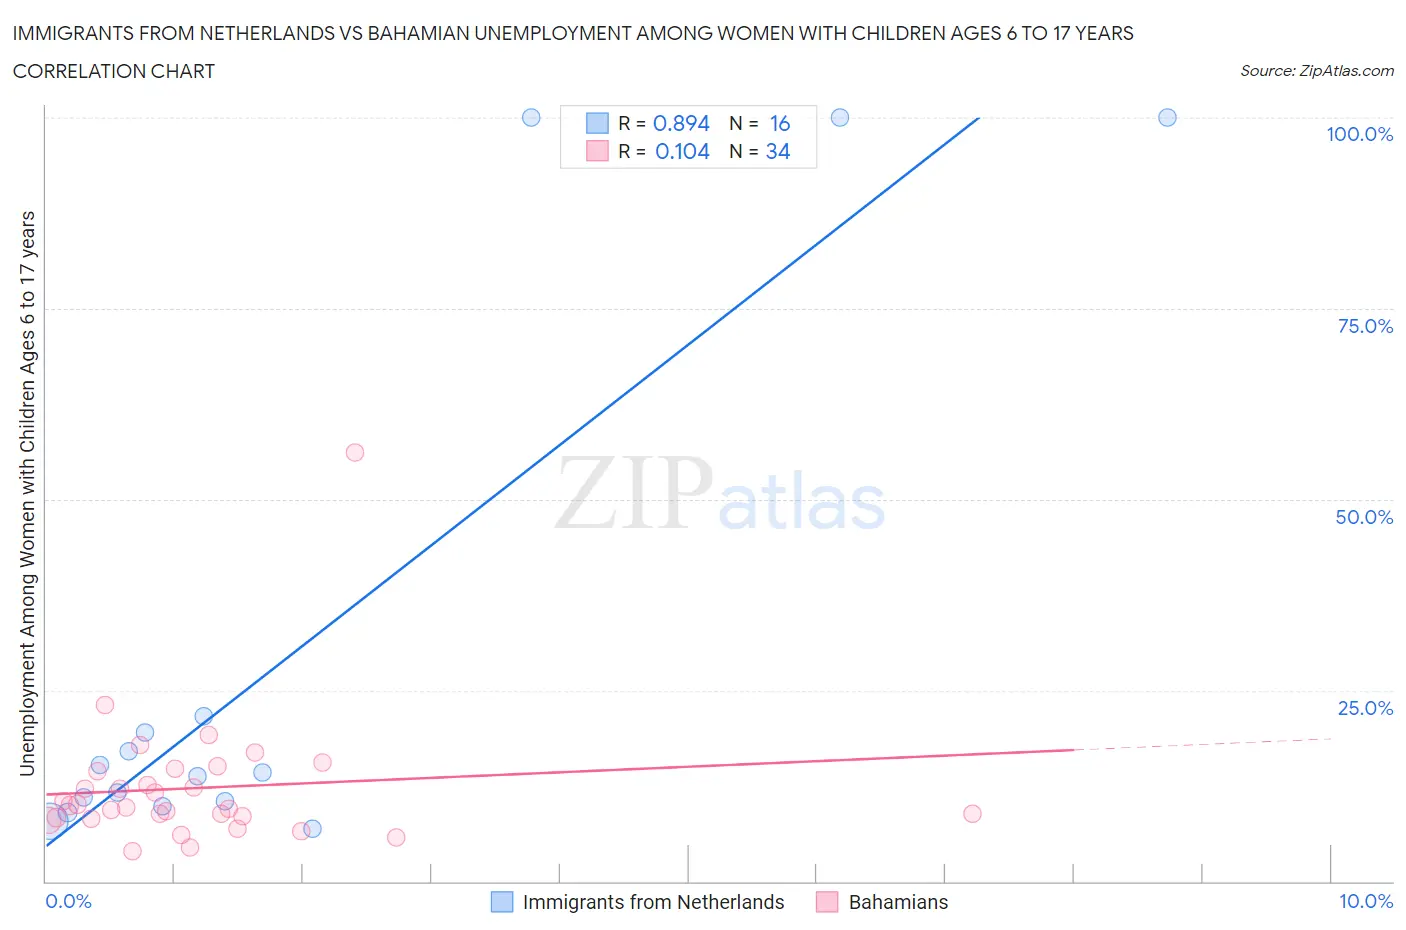
Immigrants from Netherlands vs Bahamian Unemployment Among Women with Children Ages 6 to 17 years Correlation Chart
The statistical analysis conducted on geographies consisting of 182,415,799 people shows a very strong positive correlation between the proportion of Immigrants from Netherlands and unemployment rate among women with children between the ages 6 and 17 in the United States with a correlation coefficient (R) of 0.894 and weighted average of 8.9%. Similarly, the statistical analysis conducted on geographies consisting of 97,201,604 people shows a poor positive correlation between the proportion of Bahamians and unemployment rate among women with children between the ages 6 and 17 in the United States with a correlation coefficient (R) of 0.104 and weighted average of 10.4%, a difference of 16.9%.
Unemployment Among Women with Children Ages 6 to 17 years Correlation Summary
| Measurement | Immigrants from Netherlands | Bahamian |
| Minimum | 6.8% | 4.0% |
| Maximum | 100.0% | 56.2% |
| Range | 93.2% | 52.2% |
| Mean | 29.2% | 12.2% |
| Median | 14.0% | 9.7% |
| Interquartile 25% (IQ1) | 10.1% | 8.3% |
| Interquartile 75% (IQ3) | 20.6% | 14.5% |
| Interquartile Range (IQR) | 10.4% | 6.2% |
| Standard Deviation (Sample) | 35.3% | 8.9% |
| Standard Deviation (Population) | 34.2% | 8.7% |
Similar Demographics by Unemployment Among Women with Children Ages 6 to 17 years
Demographics Similar to Immigrants from Netherlands by Unemployment Among Women with Children Ages 6 to 17 years
In terms of unemployment among women with children ages 6 to 17 years, the demographic groups most similar to Immigrants from Netherlands are Mexican American Indian (8.9%, a difference of 0.010%), Ukrainian (8.9%, a difference of 0.050%), Immigrants from Micronesia (8.9%, a difference of 0.070%), Immigrants from Guyana (8.9%, a difference of 0.10%), and Moroccan (8.9%, a difference of 0.11%).
| Demographics | Rating | Rank | Unemployment Among Women with Children Ages 6 to 17 years |
| Immigrants | Greece | 71.8 /100 | #155 | Good 8.9% |
| Osage | 65.9 /100 | #156 | Good 8.9% |
| Immigrants | Belgium | 65.6 /100 | #157 | Good 8.9% |
| Immigrants | Chile | 65.3 /100 | #158 | Good 8.9% |
| Spanish | 63.8 /100 | #159 | Good 8.9% |
| Immigrants | Hungary | 63.4 /100 | #160 | Good 8.9% |
| Immigrants | Guyana | 63.0 /100 | #161 | Good 8.9% |
| Immigrants | Netherlands | 60.8 /100 | #162 | Good 8.9% |
| Mexican American Indians | 60.6 /100 | #163 | Good 8.9% |
| Ukrainians | 59.7 /100 | #164 | Average 8.9% |
| Immigrants | Micronesia | 59.2 /100 | #165 | Average 8.9% |
| Moroccans | 58.3 /100 | #166 | Average 8.9% |
| Immigrants | England | 57.7 /100 | #167 | Average 8.9% |
| Immigrants | Croatia | 57.1 /100 | #168 | Average 8.9% |
| British | 55.2 /100 | #169 | Average 8.9% |
Demographics Similar to Bahamians by Unemployment Among Women with Children Ages 6 to 17 years
In terms of unemployment among women with children ages 6 to 17 years, the demographic groups most similar to Bahamians are Immigrants from Cabo Verde (10.4%, a difference of 0.030%), American (10.4%, a difference of 0.080%), African (10.4%, a difference of 0.26%), Immigrants from Dominica (10.5%, a difference of 0.75%), and Bermudan (10.5%, a difference of 0.87%).
| Demographics | Rating | Rank | Unemployment Among Women with Children Ages 6 to 17 years |
| Dutch West Indians | 0.0 /100 | #308 | Tragic 10.2% |
| French Canadians | 0.0 /100 | #309 | Tragic 10.3% |
| Alaska Natives | 0.0 /100 | #310 | Tragic 10.3% |
| Immigrants | Liberia | 0.0 /100 | #311 | Tragic 10.3% |
| Africans | 0.0 /100 | #312 | Tragic 10.4% |
| Americans | 0.0 /100 | #313 | Tragic 10.4% |
| Immigrants | Cabo Verde | 0.0 /100 | #314 | Tragic 10.4% |
| Bahamians | 0.0 /100 | #315 | Tragic 10.4% |
| Immigrants | Dominica | 0.0 /100 | #316 | Tragic 10.5% |
| Bermudans | 0.0 /100 | #317 | Tragic 10.5% |
| Delaware | 0.0 /100 | #318 | Tragic 10.5% |
| Immigrants | Uganda | 0.0 /100 | #319 | Tragic 10.7% |
| Apache | 0.0 /100 | #320 | Tragic 10.7% |
| Tohono O'odham | 0.0 /100 | #321 | Tragic 10.7% |
| Cree | 0.0 /100 | #322 | Tragic 10.8% |