Immigrants from Netherlands vs Argentinean Male Poverty
COMPARE
Immigrants from Netherlands
Argentinean
Male Poverty
Male Poverty Comparison
Immigrants from Netherlands
Argentineans
10.2%
MALE POVERTY
97.3/ 100
METRIC RATING
67th/ 347
METRIC RANK
10.6%
MALE POVERTY
90.1/ 100
METRIC RATING
110th/ 347
METRIC RANK
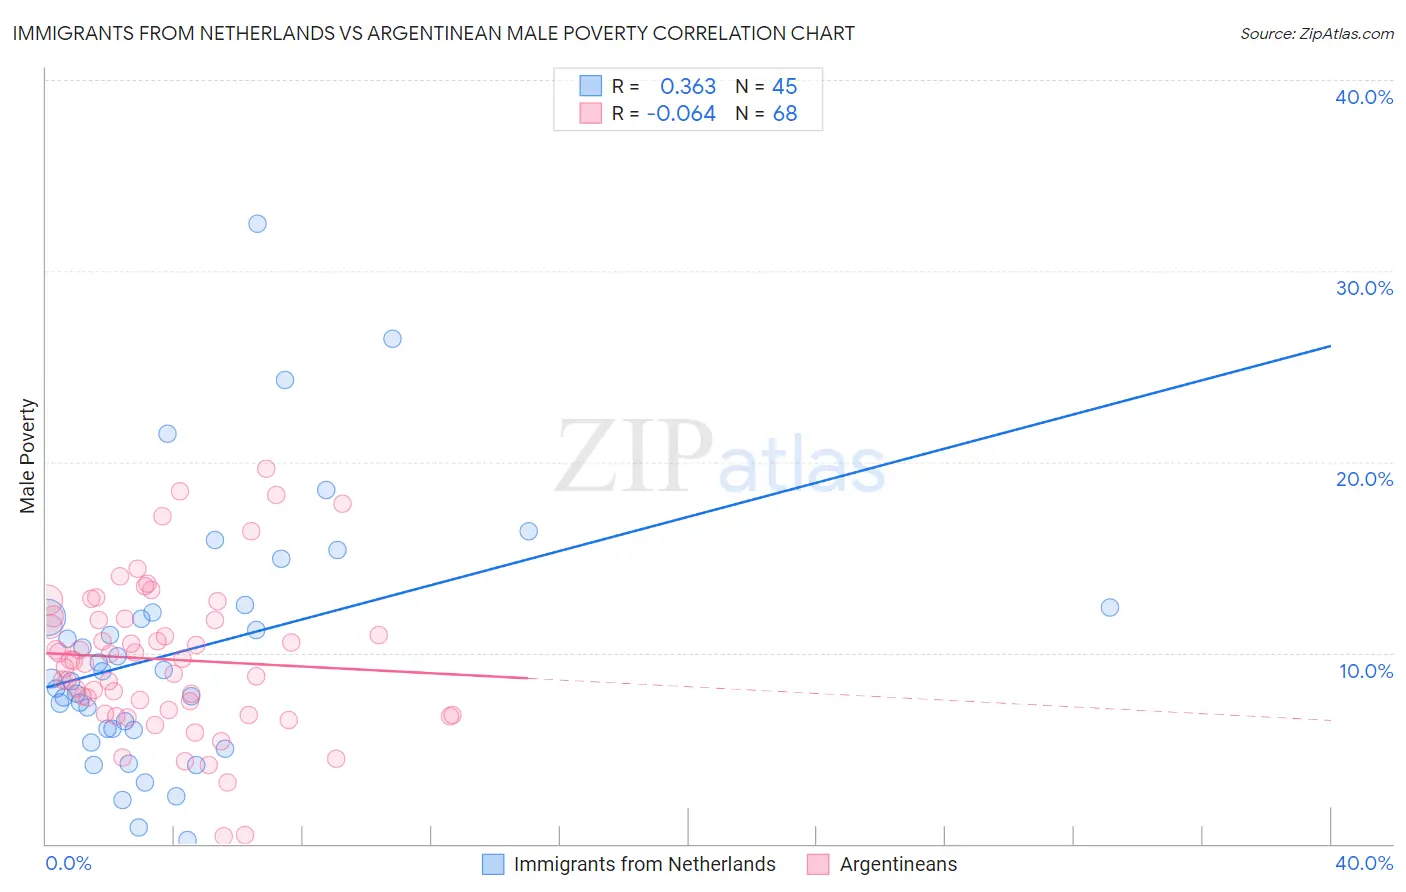
Immigrants from Netherlands vs Argentinean Male Poverty Correlation Chart
The statistical analysis conducted on geographies consisting of 237,754,800 people shows a mild positive correlation between the proportion of Immigrants from Netherlands and poverty level among males in the United States with a correlation coefficient (R) of 0.363 and weighted average of 10.2%. Similarly, the statistical analysis conducted on geographies consisting of 296,917,250 people shows a slight negative correlation between the proportion of Argentineans and poverty level among males in the United States with a correlation coefficient (R) of -0.064 and weighted average of 10.6%, a difference of 3.7%.
Male Poverty Correlation Summary
| Measurement | Immigrants from Netherlands | Argentinean |
| Minimum | 0.21% | 0.38% |
| Maximum | 32.5% | 19.6% |
| Range | 32.3% | 19.3% |
| Mean | 10.1% | 9.7% |
| Median | 8.7% | 9.6% |
| Interquartile 25% (IQ1) | 6.0% | 6.9% |
| Interquartile 75% (IQ3) | 12.3% | 11.7% |
| Interquartile Range (IQR) | 6.3% | 4.8% |
| Standard Deviation (Sample) | 6.6% | 3.9% |
| Standard Deviation (Population) | 6.6% | 3.9% |
Similar Demographics by Male Poverty
Demographics Similar to Immigrants from Netherlands by Male Poverty
In terms of male poverty, the demographic groups most similar to Immigrants from Netherlands are Immigrants from Sri Lanka (10.2%, a difference of 0.050%), Serbian (10.2%, a difference of 0.17%), Zimbabwean (10.2%, a difference of 0.18%), Immigrants from Australia (10.2%, a difference of 0.18%), and Paraguayan (10.2%, a difference of 0.20%).
| Demographics | Rating | Rank | Male Poverty |
| Ukrainians | 97.9 /100 | #60 | Exceptional 10.1% |
| Austrians | 97.8 /100 | #61 | Exceptional 10.1% |
| Immigrants | Italy | 97.8 /100 | #62 | Exceptional 10.2% |
| Slovaks | 97.7 /100 | #63 | Exceptional 10.2% |
| Swiss | 97.5 /100 | #64 | Exceptional 10.2% |
| Zimbabweans | 97.5 /100 | #65 | Exceptional 10.2% |
| Serbians | 97.5 /100 | #66 | Exceptional 10.2% |
| Immigrants | Netherlands | 97.3 /100 | #67 | Exceptional 10.2% |
| Immigrants | Sri Lanka | 97.2 /100 | #68 | Exceptional 10.2% |
| Immigrants | Australia | 97.1 /100 | #69 | Exceptional 10.2% |
| Paraguayans | 97.1 /100 | #70 | Exceptional 10.2% |
| Europeans | 97.1 /100 | #71 | Exceptional 10.2% |
| Immigrants | Canada | 97.1 /100 | #72 | Exceptional 10.2% |
| Immigrants | Asia | 97.0 /100 | #73 | Exceptional 10.2% |
| Immigrants | Eastern Europe | 96.9 /100 | #74 | Exceptional 10.2% |
Demographics Similar to Argentineans by Male Poverty
In terms of male poverty, the demographic groups most similar to Argentineans are Immigrants from Argentina (10.6%, a difference of 0.11%), Albanian (10.6%, a difference of 0.13%), Immigrants from Turkey (10.6%, a difference of 0.19%), Portuguese (10.6%, a difference of 0.26%), and Palestinian (10.6%, a difference of 0.29%).
| Demographics | Rating | Rank | Male Poverty |
| Slavs | 91.7 /100 | #103 | Exceptional 10.5% |
| Welsh | 91.6 /100 | #104 | Exceptional 10.5% |
| Canadians | 91.6 /100 | #105 | Exceptional 10.5% |
| Immigrants | Southern Europe | 91.3 /100 | #106 | Exceptional 10.5% |
| Laotians | 91.2 /100 | #107 | Exceptional 10.5% |
| Portuguese | 91.0 /100 | #108 | Exceptional 10.6% |
| Albanians | 90.6 /100 | #109 | Exceptional 10.6% |
| Argentineans | 90.1 /100 | #110 | Exceptional 10.6% |
| Immigrants | Argentina | 89.8 /100 | #111 | Excellent 10.6% |
| Immigrants | Turkey | 89.5 /100 | #112 | Excellent 10.6% |
| Palestinians | 89.1 /100 | #113 | Excellent 10.6% |
| Immigrants | Brazil | 89.0 /100 | #114 | Excellent 10.6% |
| Immigrants | Russia | 88.6 /100 | #115 | Excellent 10.6% |
| Sri Lankans | 88.1 /100 | #116 | Excellent 10.6% |
| Immigrants | South Eastern Asia | 88.1 /100 | #117 | Excellent 10.6% |