Pennsylvania German vs Northern European Male Unemployment
COMPARE
Pennsylvania German
Northern European
Male Unemployment
Male Unemployment Comparison
Pennsylvania Germans
Northern Europeans
4.8%
MALE UNEMPLOYMENT
99.9/ 100
METRIC RATING
20th/ 347
METRIC RANK
4.9%
MALE UNEMPLOYMENT
99.3/ 100
METRIC RATING
40th/ 347
METRIC RANK
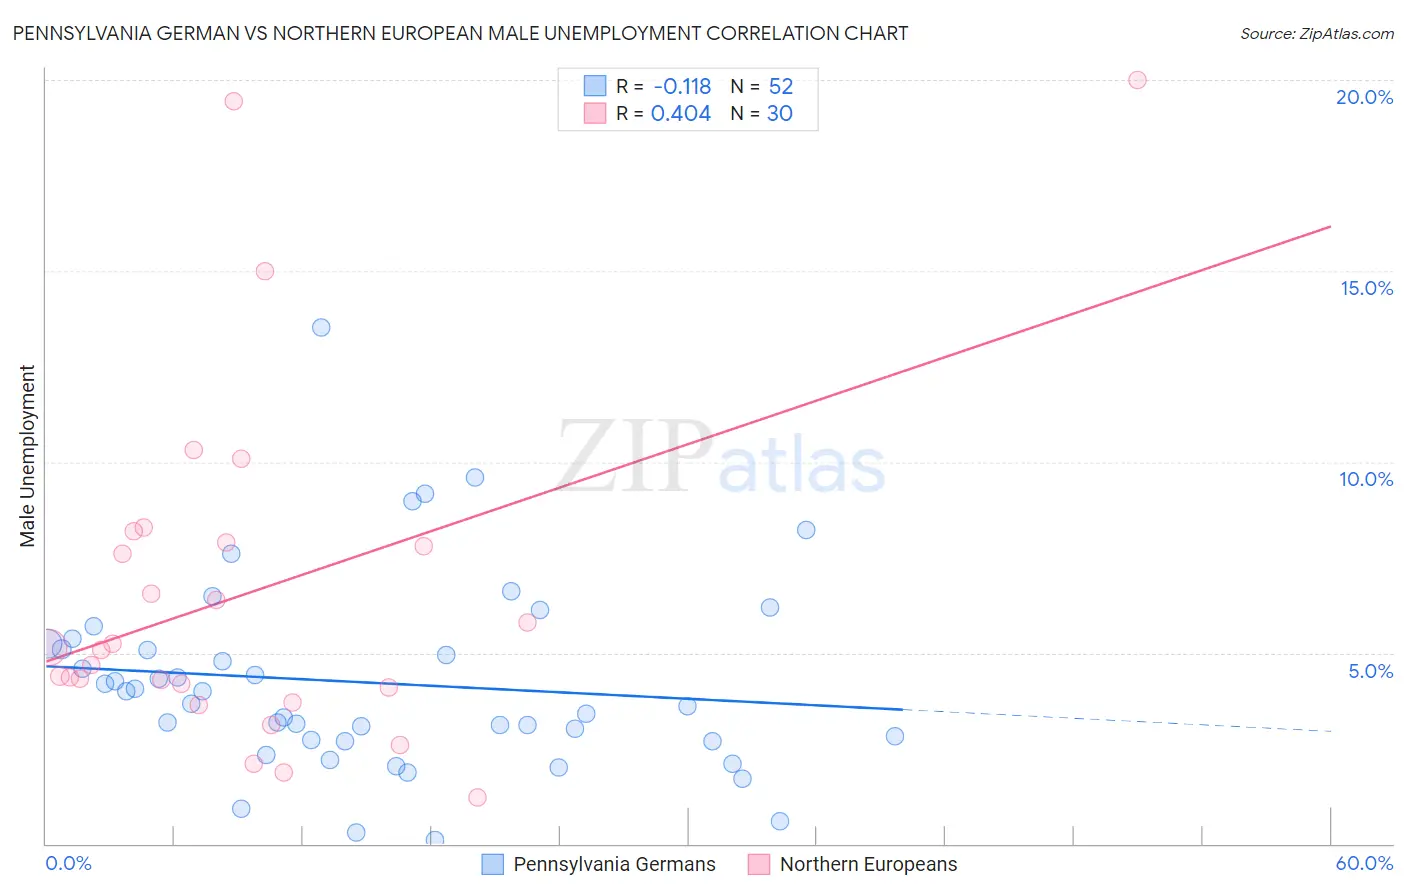
Pennsylvania German vs Northern European Male Unemployment Correlation Chart
The statistical analysis conducted on geographies consisting of 232,803,431 people shows a poor negative correlation between the proportion of Pennsylvania Germans and unemployment rate among males in the United States with a correlation coefficient (R) of -0.118 and weighted average of 4.8%. Similarly, the statistical analysis conducted on geographies consisting of 403,522,052 people shows a moderate positive correlation between the proportion of Northern Europeans and unemployment rate among males in the United States with a correlation coefficient (R) of 0.404 and weighted average of 4.9%, a difference of 3.2%.
Male Unemployment Correlation Summary
| Measurement | Pennsylvania German | Northern European |
| Minimum | 0.10% | 1.2% |
| Maximum | 13.5% | 20.0% |
| Range | 13.4% | 18.8% |
| Mean | 4.2% | 6.6% |
| Median | 3.8% | 5.1% |
| Interquartile 25% (IQ1) | 2.7% | 4.1% |
| Interquartile 75% (IQ3) | 5.2% | 7.9% |
| Interquartile Range (IQR) | 2.5% | 3.8% |
| Standard Deviation (Sample) | 2.5% | 4.6% |
| Standard Deviation (Population) | 2.5% | 4.5% |
Demographics Similar to Pennsylvania Germans and Northern Europeans by Male Unemployment
In terms of male unemployment, the demographic groups most similar to Pennsylvania Germans are Immigrants from Taiwan (4.8%, a difference of 0.16%), Carpatho Rusyn (4.8%, a difference of 0.18%), Tongan (4.8%, a difference of 0.22%), Immigrants from South Central Asia (4.8%, a difference of 0.25%), and Zimbabwean (4.8%, a difference of 0.35%). Similarly, the demographic groups most similar to Northern Europeans are Burmese (4.9%, a difference of 0.080%), Immigrants from Bosnia and Herzegovina (4.9%, a difference of 0.15%), Scotch-Irish (4.9%, a difference of 0.17%), Immigrants from Singapore (4.9%, a difference of 0.38%), and Paraguayan (4.9%, a difference of 0.46%).
| Demographics | Rating | Rank | Male Unemployment |
| Pennsylvania Germans | 99.9 /100 | #20 | Exceptional 4.8% |
| Immigrants | Taiwan | 99.9 /100 | #21 | Exceptional 4.8% |
| Carpatho Rusyns | 99.9 /100 | #22 | Exceptional 4.8% |
| Tongans | 99.9 /100 | #23 | Exceptional 4.8% |
| Immigrants | South Central Asia | 99.9 /100 | #24 | Exceptional 4.8% |
| Zimbabweans | 99.9 /100 | #25 | Exceptional 4.8% |
| Dutch | 99.9 /100 | #26 | Exceptional 4.8% |
| Belgians | 99.9 /100 | #27 | Exceptional 4.8% |
| Bulgarians | 99.8 /100 | #28 | Exceptional 4.8% |
| Scottish | 99.8 /100 | #29 | Exceptional 4.8% |
| British | 99.8 /100 | #30 | Exceptional 4.8% |
| Sudanese | 99.8 /100 | #31 | Exceptional 4.8% |
| Immigrants | Nepal | 99.8 /100 | #32 | Exceptional 4.8% |
| Latvians | 99.7 /100 | #33 | Exceptional 4.8% |
| Welsh | 99.7 /100 | #34 | Exceptional 4.8% |
| Paraguayans | 99.5 /100 | #35 | Exceptional 4.9% |
| Immigrants | Singapore | 99.4 /100 | #36 | Exceptional 4.9% |
| Scotch-Irish | 99.4 /100 | #37 | Exceptional 4.9% |
| Immigrants | Bosnia and Herzegovina | 99.4 /100 | #38 | Exceptional 4.9% |
| Burmese | 99.3 /100 | #39 | Exceptional 4.9% |
| Northern Europeans | 99.3 /100 | #40 | Exceptional 4.9% |