Immigrants from Canada vs Northern European Male Unemployment
COMPARE
Immigrants from Canada
Northern European
Male Unemployment
Male Unemployment Comparison
Immigrants from Canada
Northern Europeans
5.0%
MALE UNEMPLOYMENT
97.5/ 100
METRIC RATING
67th/ 347
METRIC RANK
4.9%
MALE UNEMPLOYMENT
99.3/ 100
METRIC RATING
40th/ 347
METRIC RANK
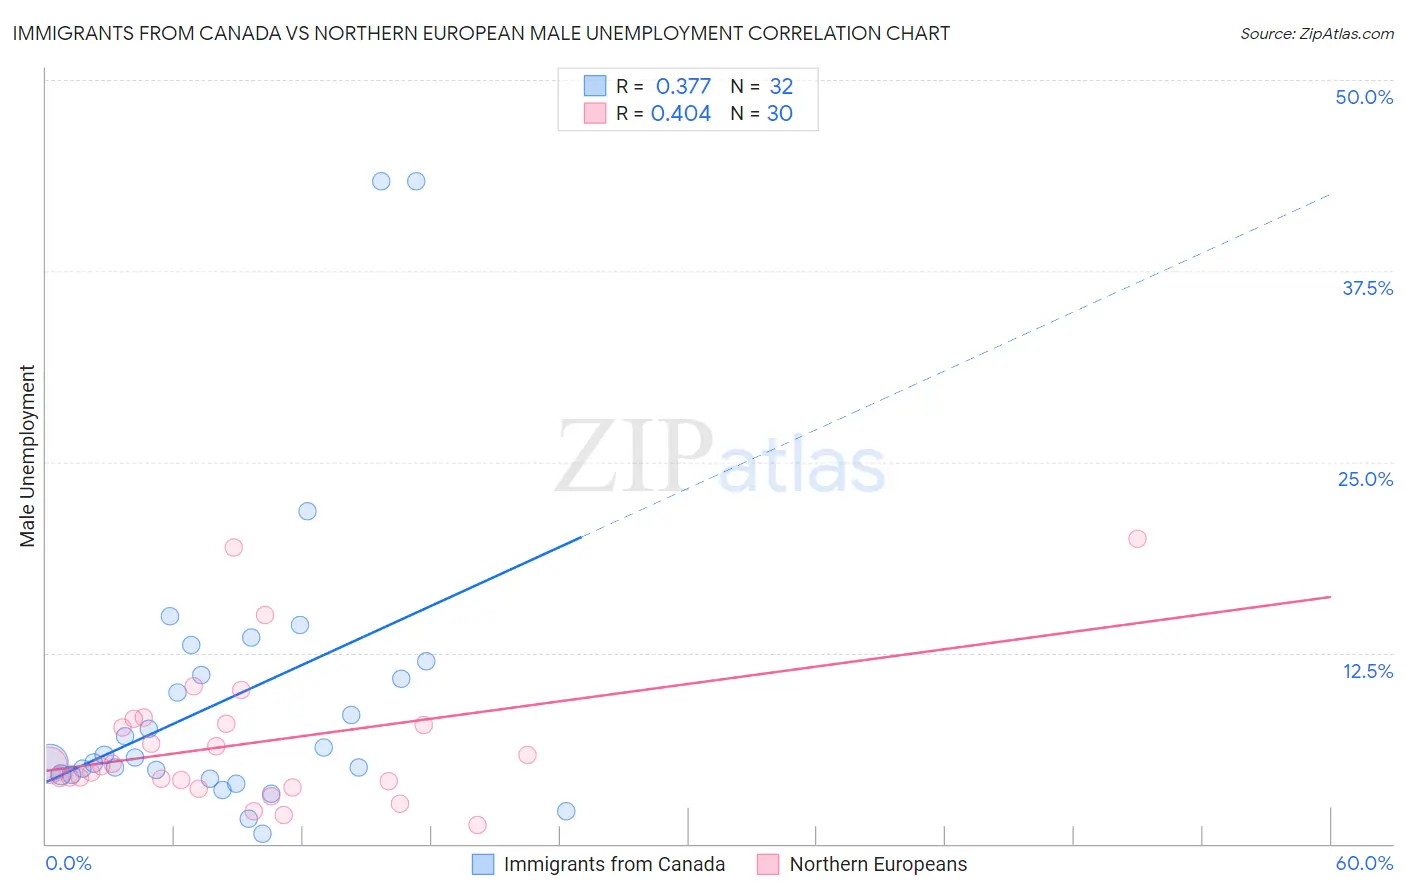
Immigrants from Canada vs Northern European Male Unemployment Correlation Chart
The statistical analysis conducted on geographies consisting of 456,364,159 people shows a mild positive correlation between the proportion of Immigrants from Canada and unemployment rate among males in the United States with a correlation coefficient (R) of 0.377 and weighted average of 5.0%. Similarly, the statistical analysis conducted on geographies consisting of 403,522,052 people shows a moderate positive correlation between the proportion of Northern Europeans and unemployment rate among males in the United States with a correlation coefficient (R) of 0.404 and weighted average of 4.9%, a difference of 2.0%.
Male Unemployment Correlation Summary
| Measurement | Immigrants from Canada | Northern European |
| Minimum | 0.66% | 1.2% |
| Maximum | 43.4% | 20.0% |
| Range | 42.7% | 18.8% |
| Mean | 9.6% | 6.6% |
| Median | 5.8% | 5.1% |
| Interquartile 25% (IQ1) | 4.5% | 4.1% |
| Interquartile 75% (IQ3) | 11.5% | 7.9% |
| Interquartile Range (IQR) | 7.0% | 3.8% |
| Standard Deviation (Sample) | 10.0% | 4.6% |
| Standard Deviation (Population) | 9.8% | 4.5% |
Similar Demographics by Male Unemployment
Demographics Similar to Immigrants from Canada by Male Unemployment
In terms of male unemployment, the demographic groups most similar to Immigrants from Canada are Australian (5.0%, a difference of 0.010%), Finnish (5.0%, a difference of 0.020%), Immigrants from Sweden (5.0%, a difference of 0.040%), White/Caucasian (5.0%, a difference of 0.090%), and Icelander (5.0%, a difference of 0.11%).
| Demographics | Rating | Rank | Male Unemployment |
| Immigrants | Argentina | 98.1 /100 | #60 | Exceptional 5.0% |
| Cambodians | 98.1 /100 | #61 | Exceptional 5.0% |
| Basques | 97.9 /100 | #62 | Exceptional 5.0% |
| Eastern Europeans | 97.9 /100 | #63 | Exceptional 5.0% |
| Celtics | 97.8 /100 | #64 | Exceptional 5.0% |
| Icelanders | 97.6 /100 | #65 | Exceptional 5.0% |
| Finns | 97.5 /100 | #66 | Exceptional 5.0% |
| Immigrants | Canada | 97.5 /100 | #67 | Exceptional 5.0% |
| Australians | 97.4 /100 | #68 | Exceptional 5.0% |
| Immigrants | Sweden | 97.4 /100 | #69 | Exceptional 5.0% |
| Whites/Caucasians | 97.3 /100 | #70 | Exceptional 5.0% |
| New Zealanders | 97.3 /100 | #71 | Exceptional 5.0% |
| Immigrants | South Africa | 97.1 /100 | #72 | Exceptional 5.0% |
| Greeks | 97.0 /100 | #73 | Exceptional 5.0% |
| Immigrants | North America | 96.9 /100 | #74 | Exceptional 5.0% |
Demographics Similar to Northern Europeans by Male Unemployment
In terms of male unemployment, the demographic groups most similar to Northern Europeans are Burmese (4.9%, a difference of 0.080%), Chinese (4.9%, a difference of 0.080%), Immigrants from Belgium (4.9%, a difference of 0.10%), Immigrants from Bosnia and Herzegovina (4.9%, a difference of 0.15%), and Scotch-Irish (4.9%, a difference of 0.17%).
| Demographics | Rating | Rank | Male Unemployment |
| Latvians | 99.7 /100 | #33 | Exceptional 4.8% |
| Welsh | 99.7 /100 | #34 | Exceptional 4.8% |
| Paraguayans | 99.5 /100 | #35 | Exceptional 4.9% |
| Immigrants | Singapore | 99.4 /100 | #36 | Exceptional 4.9% |
| Scotch-Irish | 99.4 /100 | #37 | Exceptional 4.9% |
| Immigrants | Bosnia and Herzegovina | 99.4 /100 | #38 | Exceptional 4.9% |
| Burmese | 99.3 /100 | #39 | Exceptional 4.9% |
| Northern Europeans | 99.3 /100 | #40 | Exceptional 4.9% |
| Chinese | 99.3 /100 | #41 | Exceptional 4.9% |
| Immigrants | Belgium | 99.2 /100 | #42 | Exceptional 4.9% |
| Immigrants | Japan | 99.2 /100 | #43 | Exceptional 4.9% |
| Immigrants | Korea | 99.1 /100 | #44 | Exceptional 4.9% |
| Immigrants | Zimbabwe | 99.0 /100 | #45 | Exceptional 4.9% |
| Bhutanese | 98.9 /100 | #46 | Exceptional 4.9% |
| Austrians | 98.9 /100 | #47 | Exceptional 4.9% |