Scottish vs Irish Male Unemployment
COMPARE
Scottish
Irish
Male Unemployment
Male Unemployment Comparison
Scottish
Irish
4.8%
MALE UNEMPLOYMENT
99.8/ 100
METRIC RATING
29th/ 347
METRIC RANK
5.0%
MALE UNEMPLOYMENT
98.8/ 100
METRIC RATING
52nd/ 347
METRIC RANK
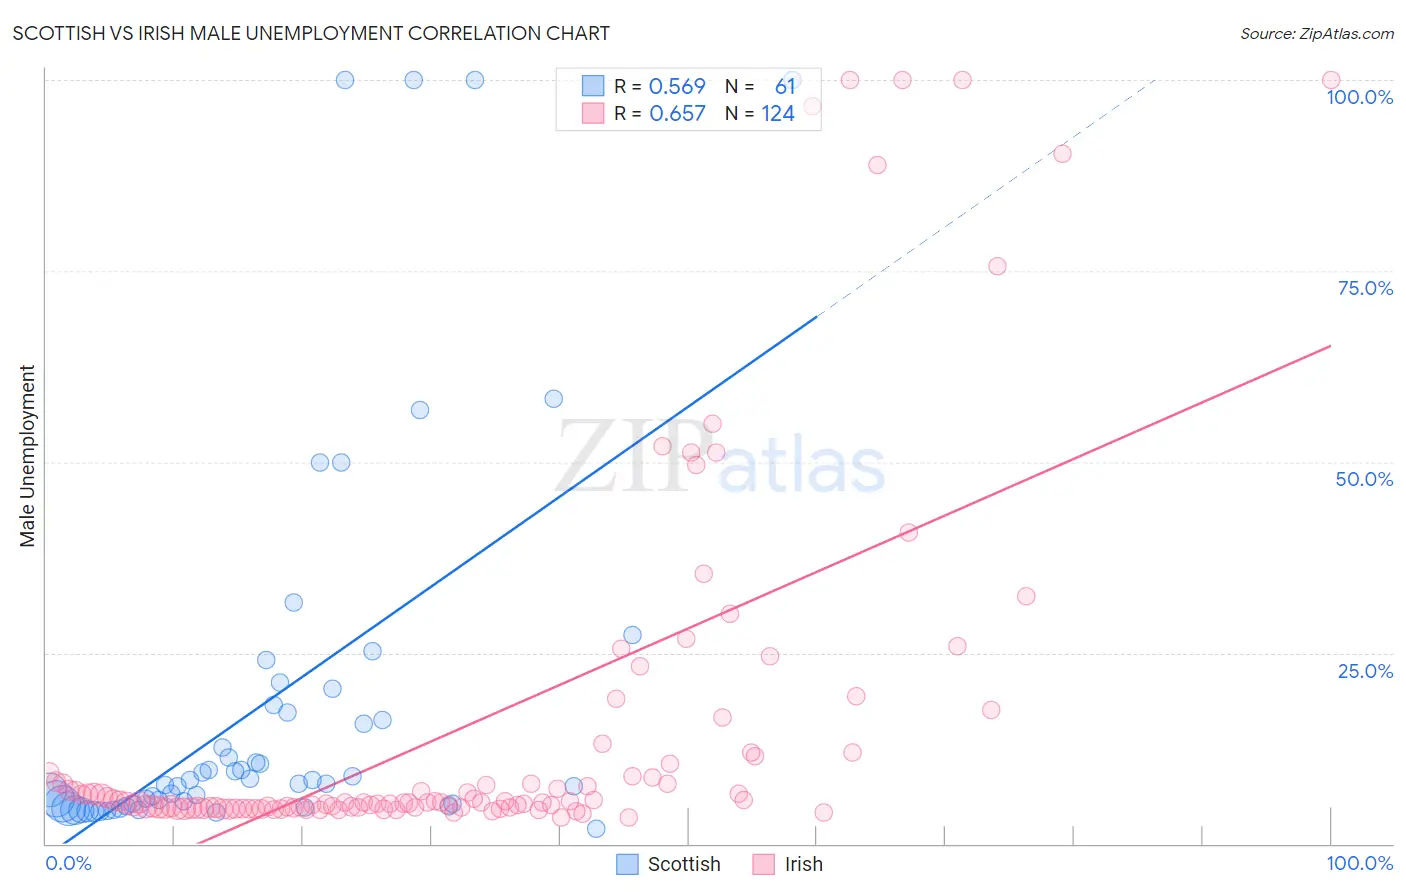
Scottish vs Irish Male Unemployment Correlation Chart
The statistical analysis conducted on geographies consisting of 556,190,347 people shows a substantial positive correlation between the proportion of Scottish and unemployment rate among males in the United States with a correlation coefficient (R) of 0.569 and weighted average of 4.8%. Similarly, the statistical analysis conducted on geographies consisting of 566,974,673 people shows a significant positive correlation between the proportion of Irish and unemployment rate among males in the United States with a correlation coefficient (R) of 0.657 and weighted average of 5.0%, a difference of 3.1%.
Male Unemployment Correlation Summary
| Measurement | Scottish | Irish |
| Minimum | 1.9% | 3.4% |
| Maximum | 100.0% | 100.0% |
| Range | 98.1% | 96.6% |
| Mean | 18.3% | 15.4% |
| Median | 7.9% | 5.4% |
| Interquartile 25% (IQ1) | 5.1% | 4.7% |
| Interquartile 75% (IQ3) | 17.7% | 9.9% |
| Interquartile Range (IQR) | 12.6% | 5.2% |
| Standard Deviation (Sample) | 25.2% | 23.5% |
| Standard Deviation (Population) | 25.0% | 23.4% |
Similar Demographics by Male Unemployment
Demographics Similar to Scottish by Male Unemployment
In terms of male unemployment, the demographic groups most similar to Scottish are Bulgarian (4.8%, a difference of 0.13%), British (4.8%, a difference of 0.31%), Belgian (4.8%, a difference of 0.32%), Dutch (4.8%, a difference of 0.52%), and Zimbabwean (4.8%, a difference of 0.54%).
| Demographics | Rating | Rank | Male Unemployment |
| Carpatho Rusyns | 99.9 /100 | #22 | Exceptional 4.8% |
| Tongans | 99.9 /100 | #23 | Exceptional 4.8% |
| Immigrants | South Central Asia | 99.9 /100 | #24 | Exceptional 4.8% |
| Zimbabweans | 99.9 /100 | #25 | Exceptional 4.8% |
| Dutch | 99.9 /100 | #26 | Exceptional 4.8% |
| Belgians | 99.9 /100 | #27 | Exceptional 4.8% |
| Bulgarians | 99.8 /100 | #28 | Exceptional 4.8% |
| Scottish | 99.8 /100 | #29 | Exceptional 4.8% |
| British | 99.8 /100 | #30 | Exceptional 4.8% |
| Sudanese | 99.8 /100 | #31 | Exceptional 4.8% |
| Immigrants | Nepal | 99.8 /100 | #32 | Exceptional 4.8% |
| Latvians | 99.7 /100 | #33 | Exceptional 4.8% |
| Welsh | 99.7 /100 | #34 | Exceptional 4.8% |
| Paraguayans | 99.5 /100 | #35 | Exceptional 4.9% |
| Immigrants | Singapore | 99.4 /100 | #36 | Exceptional 4.9% |
Demographics Similar to Irish by Male Unemployment
In terms of male unemployment, the demographic groups most similar to Irish are Slovene (5.0%, a difference of 0.020%), Polish (4.9%, a difference of 0.060%), Croatian (4.9%, a difference of 0.060%), Jordanian (5.0%, a difference of 0.060%), and Immigrants from Scotland (4.9%, a difference of 0.080%).
| Demographics | Rating | Rank | Male Unemployment |
| Immigrants | Zimbabwe | 99.0 /100 | #45 | Exceptional 4.9% |
| Bhutanese | 98.9 /100 | #46 | Exceptional 4.9% |
| Austrians | 98.9 /100 | #47 | Exceptional 4.9% |
| Immigrants | Scotland | 98.9 /100 | #48 | Exceptional 4.9% |
| Poles | 98.9 /100 | #49 | Exceptional 4.9% |
| Croatians | 98.9 /100 | #50 | Exceptional 4.9% |
| Slovenes | 98.8 /100 | #51 | Exceptional 5.0% |
| Irish | 98.8 /100 | #52 | Exceptional 5.0% |
| Jordanians | 98.8 /100 | #53 | Exceptional 5.0% |
| Yugoslavians | 98.7 /100 | #54 | Exceptional 5.0% |
| Czechoslovakians | 98.7 /100 | #55 | Exceptional 5.0% |
| Immigrants | Bulgaria | 98.7 /100 | #56 | Exceptional 5.0% |
| Turks | 98.5 /100 | #57 | Exceptional 5.0% |
| Lithuanians | 98.5 /100 | #58 | Exceptional 5.0% |
| Immigrants | Netherlands | 98.3 /100 | #59 | Exceptional 5.0% |