Indian (Asian) vs Egyptian Unemployment
COMPARE
Indian (Asian)
Egyptian
Unemployment
Unemployment Comparison
Indians (Asian)
Egyptians
5.1%
UNEMPLOYMENT
81.6/ 100
METRIC RATING
147th/ 347
METRIC RANK
5.2%
UNEMPLOYMENT
75.2/ 100
METRIC RATING
153rd/ 347
METRIC RANK
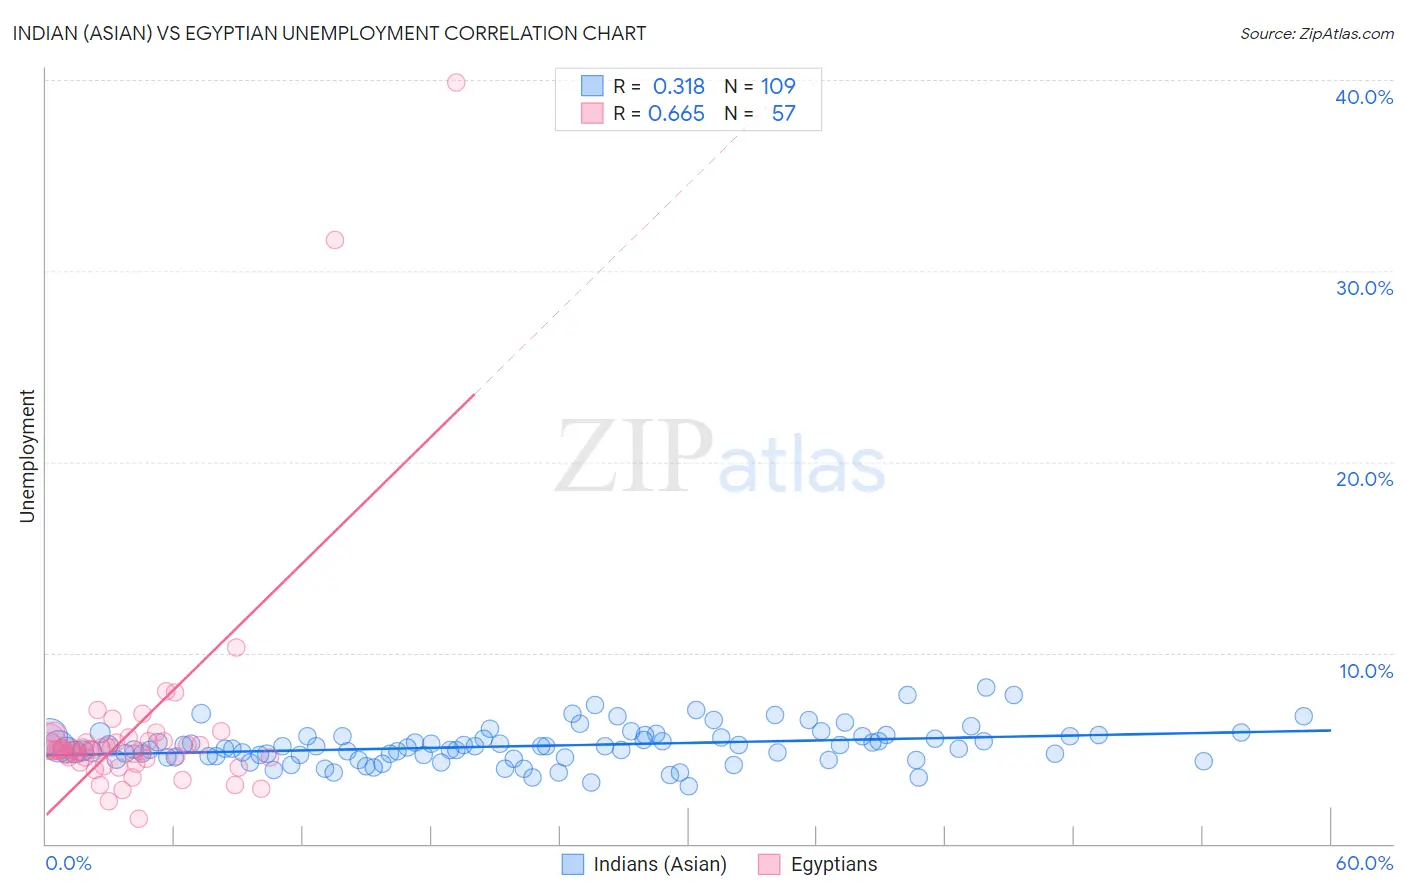
Indian (Asian) vs Egyptian Unemployment Correlation Chart
The statistical analysis conducted on geographies consisting of 494,388,692 people shows a mild positive correlation between the proportion of Indians (Asian) and unemployment in the United States with a correlation coefficient (R) of 0.318 and weighted average of 5.1%. Similarly, the statistical analysis conducted on geographies consisting of 276,825,102 people shows a significant positive correlation between the proportion of Egyptians and unemployment in the United States with a correlation coefficient (R) of 0.665 and weighted average of 5.2%, a difference of 0.60%.
Unemployment Correlation Summary
| Measurement | Indian (Asian) | Egyptian |
| Minimum | 3.0% | 1.3% |
| Maximum | 8.2% | 39.9% |
| Range | 5.2% | 38.6% |
| Mean | 5.1% | 6.0% |
| Median | 5.0% | 4.9% |
| Interquartile 25% (IQ1) | 4.5% | 4.4% |
| Interquartile 75% (IQ3) | 5.6% | 5.4% |
| Interquartile Range (IQR) | 1.1% | 1.0% |
| Standard Deviation (Sample) | 0.97% | 5.9% |
| Standard Deviation (Population) | 0.96% | 5.9% |
Demographics Similar to Indians (Asian) and Egyptians by Unemployment
In terms of unemployment, the demographic groups most similar to Indians (Asian) are Immigrants from Asia (5.1%, a difference of 0.010%), Immigrants from Norway (5.1%, a difference of 0.020%), Indonesian (5.1%, a difference of 0.070%), Immigrants from Chile (5.1%, a difference of 0.12%), and Immigrants from Pakistan (5.1%, a difference of 0.17%). Similarly, the demographic groups most similar to Egyptians are Immigrants from Hong Kong (5.2%, a difference of 0.0%), Immigrants from Eastern Europe (5.2%, a difference of 0.010%), Immigrants from China (5.2%, a difference of 0.040%), Potawatomi (5.2%, a difference of 0.080%), and Syrian (5.2%, a difference of 0.22%).
| Demographics | Rating | Rank | Unemployment |
| Immigrants | Denmark | 84.3 /100 | #140 | Excellent 5.1% |
| Palestinians | 83.4 /100 | #141 | Excellent 5.1% |
| Immigrants | Pakistan | 83.2 /100 | #142 | Excellent 5.1% |
| Immigrants | Chile | 82.8 /100 | #143 | Excellent 5.1% |
| Indonesians | 82.3 /100 | #144 | Excellent 5.1% |
| Immigrants | Norway | 81.8 /100 | #145 | Excellent 5.1% |
| Immigrants | Asia | 81.8 /100 | #146 | Excellent 5.1% |
| Indians (Asian) | 81.6 /100 | #147 | Excellent 5.1% |
| Immigrants | Italy | 79.1 /100 | #148 | Good 5.1% |
| Syrians | 77.7 /100 | #149 | Good 5.2% |
| Potawatomi | 76.2 /100 | #150 | Good 5.2% |
| Immigrants | Eastern Europe | 75.3 /100 | #151 | Good 5.2% |
| Immigrants | Hong Kong | 75.2 /100 | #152 | Good 5.2% |
| Egyptians | 75.2 /100 | #153 | Good 5.2% |
| Immigrants | China | 74.7 /100 | #154 | Good 5.2% |
| Immigrants | Northern Africa | 71.3 /100 | #155 | Good 5.2% |
| Immigrants | Kazakhstan | 70.4 /100 | #156 | Good 5.2% |
| Sri Lankans | 69.5 /100 | #157 | Good 5.2% |
| Immigrants | Egypt | 66.7 /100 | #158 | Good 5.2% |
| Immigrants | Russia | 66.6 /100 | #159 | Good 5.2% |
| Laotians | 66.3 /100 | #160 | Good 5.2% |