Immigrants from Lithuania vs Kenyan Unemployment Among Youth under 25 years
COMPARE
Immigrants from Lithuania
Kenyan
Unemployment Among Youth under 25 years
Unemployment Among Youth under 25 years Comparison
Immigrants from Lithuania
Kenyans
11.3%
UNEMPLOYMENT AMONG YOUTH UNDER 25 YEARS
92.9/ 100
METRIC RATING
107th/ 347
METRIC RANK
11.2%
UNEMPLOYMENT AMONG YOUTH UNDER 25 YEARS
95.7/ 100
METRIC RATING
87th/ 347
METRIC RANK
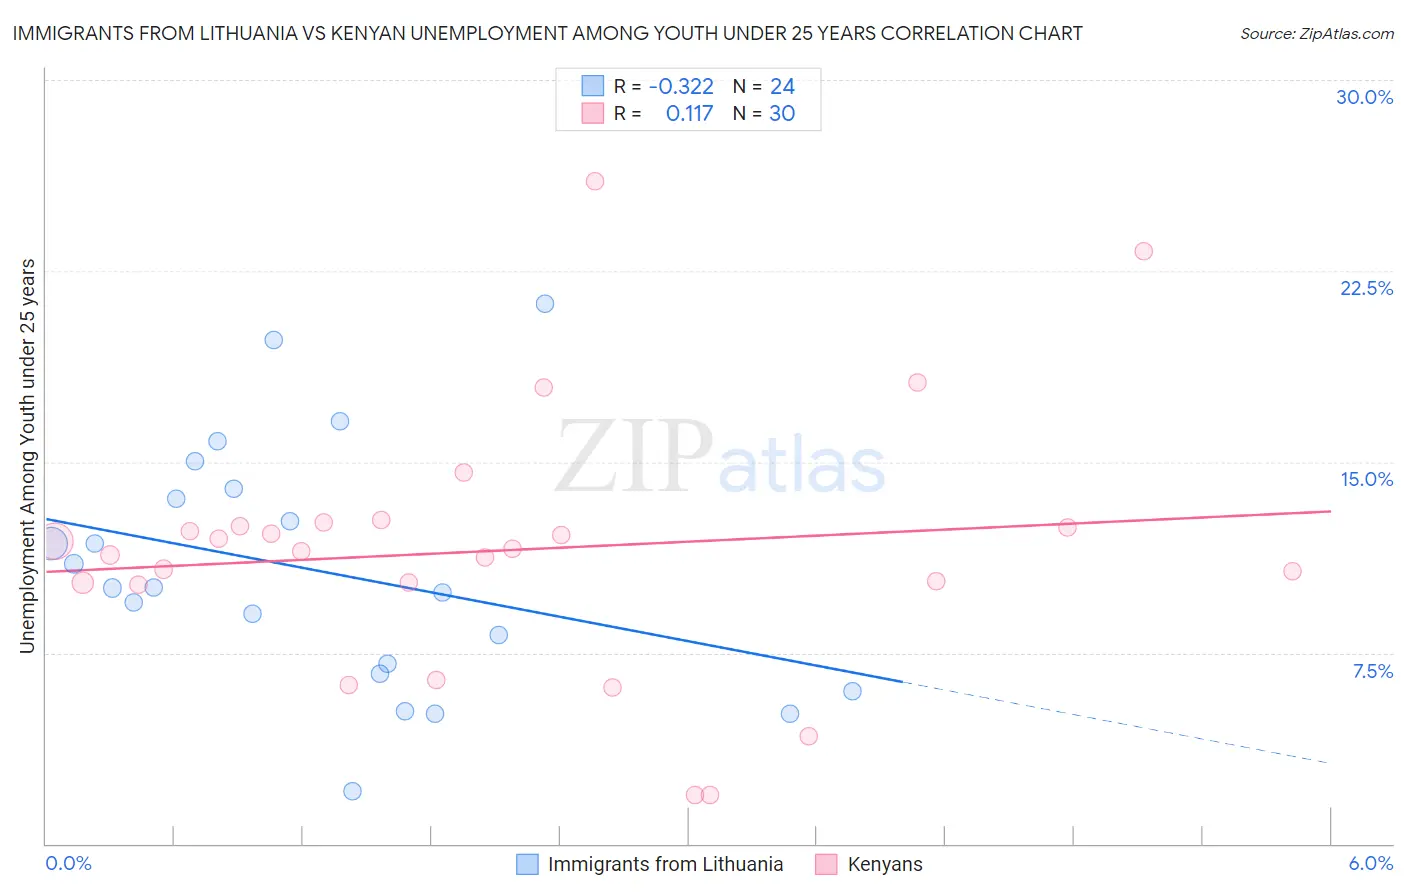
Immigrants from Lithuania vs Kenyan Unemployment Among Youth under 25 years Correlation Chart
The statistical analysis conducted on geographies consisting of 117,251,383 people shows a mild negative correlation between the proportion of Immigrants from Lithuania and unemployment rate among youth under the age of 25 in the United States with a correlation coefficient (R) of -0.322 and weighted average of 11.3%. Similarly, the statistical analysis conducted on geographies consisting of 167,662,123 people shows a poor positive correlation between the proportion of Kenyans and unemployment rate among youth under the age of 25 in the United States with a correlation coefficient (R) of 0.117 and weighted average of 11.2%, a difference of 0.57%.
Unemployment Among Youth under 25 years Correlation Summary
| Measurement | Immigrants from Lithuania | Kenyan |
| Minimum | 2.0% | 1.9% |
| Maximum | 21.2% | 26.0% |
| Range | 19.1% | 24.1% |
| Mean | 10.7% | 11.5% |
| Median | 10.1% | 11.5% |
| Interquartile 25% (IQ1) | 6.9% | 10.2% |
| Interquartile 75% (IQ3) | 13.7% | 12.5% |
| Interquartile Range (IQR) | 6.9% | 2.2% |
| Standard Deviation (Sample) | 4.8% | 5.2% |
| Standard Deviation (Population) | 4.7% | 5.1% |
Demographics Similar to Immigrants from Lithuania and Kenyans by Unemployment Among Youth under 25 years
In terms of unemployment among youth under 25 years, the demographic groups most similar to Immigrants from Lithuania are Chilean (11.3%, a difference of 0.020%), Immigrants from Jordan (11.3%, a difference of 0.030%), Immigrants from Afghanistan (11.3%, a difference of 0.090%), Immigrants from Thailand (11.3%, a difference of 0.11%), and Immigrants from Malaysia (11.3%, a difference of 0.11%). Similarly, the demographic groups most similar to Kenyans are Austrian (11.2%, a difference of 0.050%), Immigrants from Japan (11.2%, a difference of 0.060%), Immigrants from Bolivia (11.2%, a difference of 0.070%), Immigrants from Taiwan (11.2%, a difference of 0.15%), and Immigrants from Latvia (11.2%, a difference of 0.15%).
| Demographics | Rating | Rank | Unemployment Among Youth under 25 years |
| Kenyans | 95.7 /100 | #87 | Exceptional 11.2% |
| Austrians | 95.5 /100 | #88 | Exceptional 11.2% |
| Immigrants | Japan | 95.5 /100 | #89 | Exceptional 11.2% |
| Immigrants | Bolivia | 95.5 /100 | #90 | Exceptional 11.2% |
| Immigrants | Taiwan | 95.1 /100 | #91 | Exceptional 11.2% |
| Immigrants | Latvia | 95.1 /100 | #92 | Exceptional 11.2% |
| Immigrants | North America | 95.1 /100 | #93 | Exceptional 11.2% |
| Lithuanians | 94.8 /100 | #94 | Exceptional 11.3% |
| Carpatho Rusyns | 94.4 /100 | #95 | Exceptional 11.3% |
| Immigrants | Serbia | 94.4 /100 | #96 | Exceptional 11.3% |
| Nicaraguans | 94.3 /100 | #97 | Exceptional 11.3% |
| Estonians | 94.2 /100 | #98 | Exceptional 11.3% |
| Celtics | 94.0 /100 | #99 | Exceptional 11.3% |
| Pakistanis | 94.0 /100 | #100 | Exceptional 11.3% |
| Iroquois | 93.8 /100 | #101 | Exceptional 11.3% |
| Immigrants | Thailand | 93.6 /100 | #102 | Exceptional 11.3% |
| Immigrants | Malaysia | 93.6 /100 | #103 | Exceptional 11.3% |
| Immigrants | Afghanistan | 93.4 /100 | #104 | Exceptional 11.3% |
| Immigrants | Jordan | 93.1 /100 | #105 | Exceptional 11.3% |
| Chileans | 93.0 /100 | #106 | Exceptional 11.3% |
| Immigrants | Lithuania | 92.9 /100 | #107 | Exceptional 11.3% |