Immigrants from Lithuania vs German Russian Unemployment Among Youth under 25 years
COMPARE
Immigrants from Lithuania
German Russian
Unemployment Among Youth under 25 years
Unemployment Among Youth under 25 years Comparison
Immigrants from Lithuania
German Russians
11.3%
UNEMPLOYMENT AMONG YOUTH UNDER 25 YEARS
92.9/ 100
METRIC RATING
107th/ 347
METRIC RANK
11.2%
UNEMPLOYMENT AMONG YOUTH UNDER 25 YEARS
97.0/ 100
METRIC RATING
76th/ 347
METRIC RANK
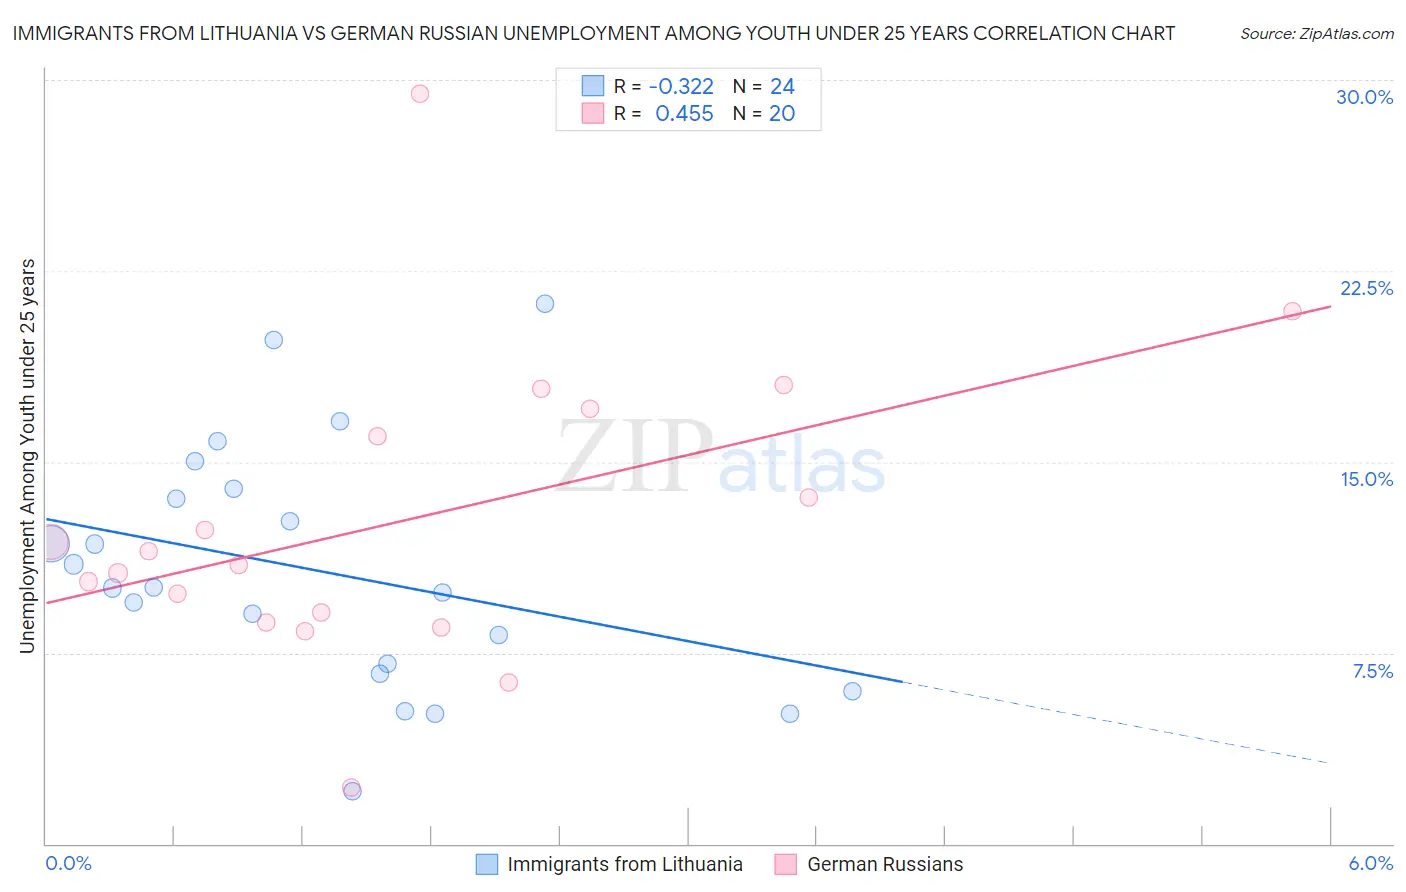
Immigrants from Lithuania vs German Russian Unemployment Among Youth under 25 years Correlation Chart
The statistical analysis conducted on geographies consisting of 117,251,383 people shows a mild negative correlation between the proportion of Immigrants from Lithuania and unemployment rate among youth under the age of 25 in the United States with a correlation coefficient (R) of -0.322 and weighted average of 11.3%. Similarly, the statistical analysis conducted on geographies consisting of 95,940,958 people shows a moderate positive correlation between the proportion of German Russians and unemployment rate among youth under the age of 25 in the United States with a correlation coefficient (R) of 0.455 and weighted average of 11.2%, a difference of 0.97%.
Unemployment Among Youth under 25 years Correlation Summary
| Measurement | Immigrants from Lithuania | German Russian |
| Minimum | 2.0% | 2.2% |
| Maximum | 21.2% | 29.4% |
| Range | 19.1% | 27.2% |
| Mean | 10.7% | 12.7% |
| Median | 10.1% | 11.2% |
| Interquartile 25% (IQ1) | 6.9% | 8.9% |
| Interquartile 75% (IQ3) | 13.7% | 16.5% |
| Interquartile Range (IQR) | 6.9% | 7.6% |
| Standard Deviation (Sample) | 4.8% | 6.0% |
| Standard Deviation (Population) | 4.7% | 5.8% |
Similar Demographics by Unemployment Among Youth under 25 years
Demographics Similar to Immigrants from Lithuania by Unemployment Among Youth under 25 years
In terms of unemployment among youth under 25 years, the demographic groups most similar to Immigrants from Lithuania are Immigrants from Kuwait (11.3%, a difference of 0.010%), Chilean (11.3%, a difference of 0.020%), Immigrants from Jordan (11.3%, a difference of 0.030%), Immigrants from Afghanistan (11.3%, a difference of 0.090%), and Immigrants from Thailand (11.3%, a difference of 0.11%).
| Demographics | Rating | Rank | Unemployment Among Youth under 25 years |
| Pakistanis | 94.0 /100 | #100 | Exceptional 11.3% |
| Iroquois | 93.8 /100 | #101 | Exceptional 11.3% |
| Immigrants | Thailand | 93.6 /100 | #102 | Exceptional 11.3% |
| Immigrants | Malaysia | 93.6 /100 | #103 | Exceptional 11.3% |
| Immigrants | Afghanistan | 93.4 /100 | #104 | Exceptional 11.3% |
| Immigrants | Jordan | 93.1 /100 | #105 | Exceptional 11.3% |
| Chileans | 93.0 /100 | #106 | Exceptional 11.3% |
| Immigrants | Lithuania | 92.9 /100 | #107 | Exceptional 11.3% |
| Immigrants | Kuwait | 92.9 /100 | #108 | Exceptional 11.3% |
| Iranians | 92.0 /100 | #109 | Exceptional 11.3% |
| Immigrants | Norway | 91.5 /100 | #110 | Exceptional 11.3% |
| Immigrants | France | 90.3 /100 | #111 | Exceptional 11.3% |
| Immigrants | Austria | 90.3 /100 | #112 | Exceptional 11.3% |
| Fijians | 90.2 /100 | #113 | Exceptional 11.3% |
| Immigrants | Ethiopia | 89.9 /100 | #114 | Excellent 11.3% |
Demographics Similar to German Russians by Unemployment Among Youth under 25 years
In terms of unemployment among youth under 25 years, the demographic groups most similar to German Russians are French (11.2%, a difference of 0.020%), New Zealander (11.2%, a difference of 0.050%), White/Caucasian (11.2%, a difference of 0.050%), Creek (11.2%, a difference of 0.060%), and Immigrants from Australia (11.2%, a difference of 0.11%).
| Demographics | Rating | Rank | Unemployment Among Youth under 25 years |
| Immigrants | Moldova | 97.5 /100 | #69 | Exceptional 11.2% |
| Slavs | 97.5 /100 | #70 | Exceptional 11.2% |
| Bhutanese | 97.4 /100 | #71 | Exceptional 11.2% |
| Immigrants | Australia | 97.3 /100 | #72 | Exceptional 11.2% |
| Creek | 97.2 /100 | #73 | Exceptional 11.2% |
| New Zealanders | 97.2 /100 | #74 | Exceptional 11.2% |
| French | 97.1 /100 | #75 | Exceptional 11.2% |
| German Russians | 97.0 /100 | #76 | Exceptional 11.2% |
| Whites/Caucasians | 96.9 /100 | #77 | Exceptional 11.2% |
| Immigrants | Nicaragua | 96.7 /100 | #78 | Exceptional 11.2% |
| Immigrants | Canada | 96.7 /100 | #79 | Exceptional 11.2% |
| Immigrants | Bulgaria | 96.4 /100 | #80 | Exceptional 11.2% |
| Icelanders | 96.3 /100 | #81 | Exceptional 11.2% |
| Northern Europeans | 96.2 /100 | #82 | Exceptional 11.2% |
| Bolivians | 96.1 /100 | #83 | Exceptional 11.2% |