Irish vs Kenyan Unemployment Among Youth under 25 years

COMPARE

Irish
Race
Ancestry
AfghanAfricanAlaska NativeAlaskan AthabascanAlbanianAleutAlsatianAmericanApacheArabArapahoArgentineanArmenianAssyrian/Chaldean/SyriacAustralianAustrianBahamianBangladeshiBarbadianBasqueBelgianBelizeanBermudanBhutaneseBlackfeetBolivianBrazilianBritishBritish West IndianBulgarianBurmeseCajunCambodianCanadianCape VerdeanCarpatho RusynCelticCentral AmericanCentral American IndianCherokeeCheyenneChickasawChileanChineseChippewaChoctawColombianColvilleComancheCosta RicanCreeCreekCroatianCrowCubanCypriotCzechCzechoslovakianDanishDelawareDominicanDutchDutch West IndianEastern EuropeanEcuadorianEgyptianEnglishEstonianEthiopianEuropeanFijianFilipinoFinnishFrenchFrench American IndianFrench CanadianGermanGerman RussianGhanaianGreekGuamanian/ChamorroGuatemalanGuyaneseHaitianHmongHonduranHopiHoumaHungarianIcelanderIndian (Asian)IndonesianInupiatIranianIraqiIrishIroquoisIsraeliItalianJamaicanJapaneseJordanianKiowaKoreanLaotianLatvianLebaneseLiberianLithuanianLumbeeLuxembourgerMacedonianMalaysianMalteseMarshalleseMenomineeMexicanMexican American IndianMongolianMoroccanNative HawaiianNavajoNepaleseNew ZealanderNicaraguanNigerianNorthern EuropeanNorwegianOkinawanOsageOttawaPaiutePakistaniPalestinianPanamanianParaguayanPennsylvania GermanPeruvianPimaPolishPortuguesePotawatomiPuebloPuerto RicanPuget Sound SalishRomanianRussianSalvadoranSamoanScandinavianScotch-IrishScottishSeminoleSenegaleseSerbianShoshoneSierra LeoneanSiouxSlavicSlovakSloveneSomaliSouth AfricanSouth AmericanSouth American IndianSoviet UnionSpaniardSpanishSpanish AmericanSpanish American IndianSri LankanSubsaharan AfricanSudaneseSwedishSwissSyrianTaiwaneseThaiTlingit-HaidaTohono O'OdhamTonganTrinidadian and TobagonianTsimshianTurkishU.S. Virgin IslanderUgandanUkrainianUruguayanUteVenezuelanVietnameseWelshWest IndianYakamaYaquiYugoslavianYumanYup'ikZimbabwean
Immigration
NonimmigrantsImmigrantsAfghanistanAfricaAlbaniaArgentinaArmeniaAsiaAustraliaAustriaBahamasBangladeshBarbadosBelarusBelgiumBelizeBoliviaBosnia and HerzegovinaBrazilBulgariaBurma/MyanmarCabo VerdeCambodiaCameroonCanadaCaribbeanCentral AmericaChileChinaColombiaCongoCosta RicaCroatiaCubaCzechoslovakiaDenmarkDominicaDominican RepublicEastern AfricaEastern AsiaEastern EuropeEcuadorEgyptEl SalvadorEnglandEritreaEthiopiaEuropeFijiFranceGermanyGhanaGreeceGrenadaGuatemalaGuyanaHaitiHondurasHong KongHungaryIndiaIndonesiaIranIraqIrelandIsraelItalyJamaicaJapanJordanKazakhstanKenyaKoreaKuwaitLaosLatin AmericaLatviaLebanonLiberiaLithuaniaMalaysiaMexicoMicronesiaMiddle AfricaMoldovaMoroccoNepalNetherlandsNicaraguaNigeriaNorth AmericaNorth MacedoniaNorthern AfricaNorthern EuropeNorwayOceaniaPakistanPanamaPeruPhilippinesPolandPortugalRomaniaRussiaSaudi ArabiaScotlandSenegalSerbiaSierra LeoneSingaporeSomaliaSouth AfricaSouth AmericaSouth Central AsiaSouth Eastern AsiaSouthern EuropeSpainSri LankaSt. Vincent and the GrenadinesSudanSwedenSwitzerlandSyriaTaiwanThailandTrinidad and TobagoTurkeyUgandaUkraineUruguayUzbekistanVenezuelaVietnamWest IndiesWestern AfricaWestern AsiaWestern EuropeYemenZaireZimbabweAzores
Kenyan
Race
Ancestry
AfghanAfricanAlaska NativeAlaskan AthabascanAlbanianAleutAlsatianAmericanApacheArabArapahoArgentineanArmenianAssyrian/Chaldean/SyriacAustralianAustrianBahamianBangladeshiBarbadianBasqueBelgianBelizeanBermudanBhutaneseBlackfeetBolivianBrazilianBritishBritish West IndianBulgarianBurmeseCajunCambodianCanadianCape VerdeanCarpatho RusynCelticCentral AmericanCentral American IndianCherokeeCheyenneChickasawChileanChineseChippewaChoctawColombianColvilleComancheCosta RicanCreeCreekCroatianCrowCubanCypriotCzechCzechoslovakianDanishDelawareDominicanDutchDutch West IndianEastern EuropeanEcuadorianEgyptianEnglishEstonianEthiopianEuropeanFijianFilipinoFinnishFrenchFrench American IndianFrench CanadianGermanGerman RussianGhanaianGreekGuamanian/ChamorroGuatemalanGuyaneseHaitianHmongHonduranHopiHoumaHungarianIcelanderIndian (Asian)IndonesianInupiatIranianIraqiIroquoisIsraeliItalianJamaicanJapaneseJordanianKenyanKiowaKoreanLaotianLatvianLebaneseLiberianLithuanianLumbeeLuxembourgerMacedonianMalaysianMalteseMarshalleseMenomineeMexicanMexican American IndianMongolianMoroccanNative HawaiianNavajoNepaleseNew ZealanderNicaraguanNigerianNorthern EuropeanNorwegianOkinawanOsageOttawaPaiutePakistaniPalestinianPanamanianParaguayanPennsylvania GermanPeruvianPimaPolishPortuguesePotawatomiPuebloPuerto RicanPuget Sound SalishRomanianRussianSalvadoranSamoanScandinavianScotch-IrishScottishSeminoleSenegaleseSerbianShoshoneSierra LeoneanSiouxSlavicSlovakSloveneSomaliSouth AfricanSouth AmericanSouth American IndianSoviet UnionSpaniardSpanishSpanish AmericanSpanish American IndianSri LankanSubsaharan AfricanSudaneseSwedishSwissSyrianTaiwaneseThaiTlingit-HaidaTohono O'OdhamTonganTrinidadian and TobagonianTsimshianTurkishU.S. Virgin IslanderUgandanUkrainianUruguayanUteVenezuelanVietnameseWelshWest IndianYakamaYaquiYugoslavianYumanYup'ikZimbabwean
Immigration
NonimmigrantsImmigrantsAfghanistanAfricaAlbaniaArgentinaArmeniaAsiaAustraliaAustriaBahamasBangladeshBarbadosBelarusBelgiumBelizeBoliviaBosnia and HerzegovinaBrazilBulgariaBurma/MyanmarCabo VerdeCambodiaCameroonCanadaCaribbeanCentral AmericaChileChinaColombiaCongoCosta RicaCroatiaCubaCzechoslovakiaDenmarkDominicaDominican RepublicEastern AfricaEastern AsiaEastern EuropeEcuadorEgyptEl SalvadorEnglandEritreaEthiopiaEuropeFijiFranceGermanyGhanaGreeceGrenadaGuatemalaGuyanaHaitiHondurasHong KongHungaryIndiaIndonesiaIranIraqIrelandIsraelItalyJamaicaJapanJordanKazakhstanKenyaKoreaKuwaitLaosLatin AmericaLatviaLebanonLiberiaLithuaniaMalaysiaMexicoMicronesiaMiddle AfricaMoldovaMoroccoNepalNetherlandsNicaraguaNigeriaNorth AmericaNorth MacedoniaNorthern AfricaNorthern EuropeNorwayOceaniaPakistanPanamaPeruPhilippinesPolandPortugalRomaniaRussiaSaudi ArabiaScotlandSenegalSerbiaSierra LeoneSingaporeSomaliaSouth AfricaSouth AmericaSouth Central AsiaSouth Eastern AsiaSouthern EuropeSpainSri LankaSt. Vincent and the GrenadinesSudanSwedenSwitzerlandSyriaTaiwanThailandTrinidad and TobagoTurkeyUgandaUkraineUruguayUzbekistanVenezuelaVietnamWest IndiesWestern AfricaWestern AsiaWestern EuropeYemenZaireZimbabweAzores
Unemployment Among Youth under 25 years
Income
Poverty
Unemployment
Labor Participation
Family Structure
Vehicle Availability
Education Level
Disability

Unemployment Among Youth under 25 years Comparison

Irish

Kenyans

Exceptional
Exceptional
11.1%
UNEMPLOYMENT AMONG YOUTH UNDER 25 YEARS
98.9/ 100
METRIC RATING
55th/ 347
METRIC RANK
11.2%
UNEMPLOYMENT AMONG YOUTH UNDER 25 YEARS
95.7/ 100
METRIC RATING
87th/ 347
METRIC RANK

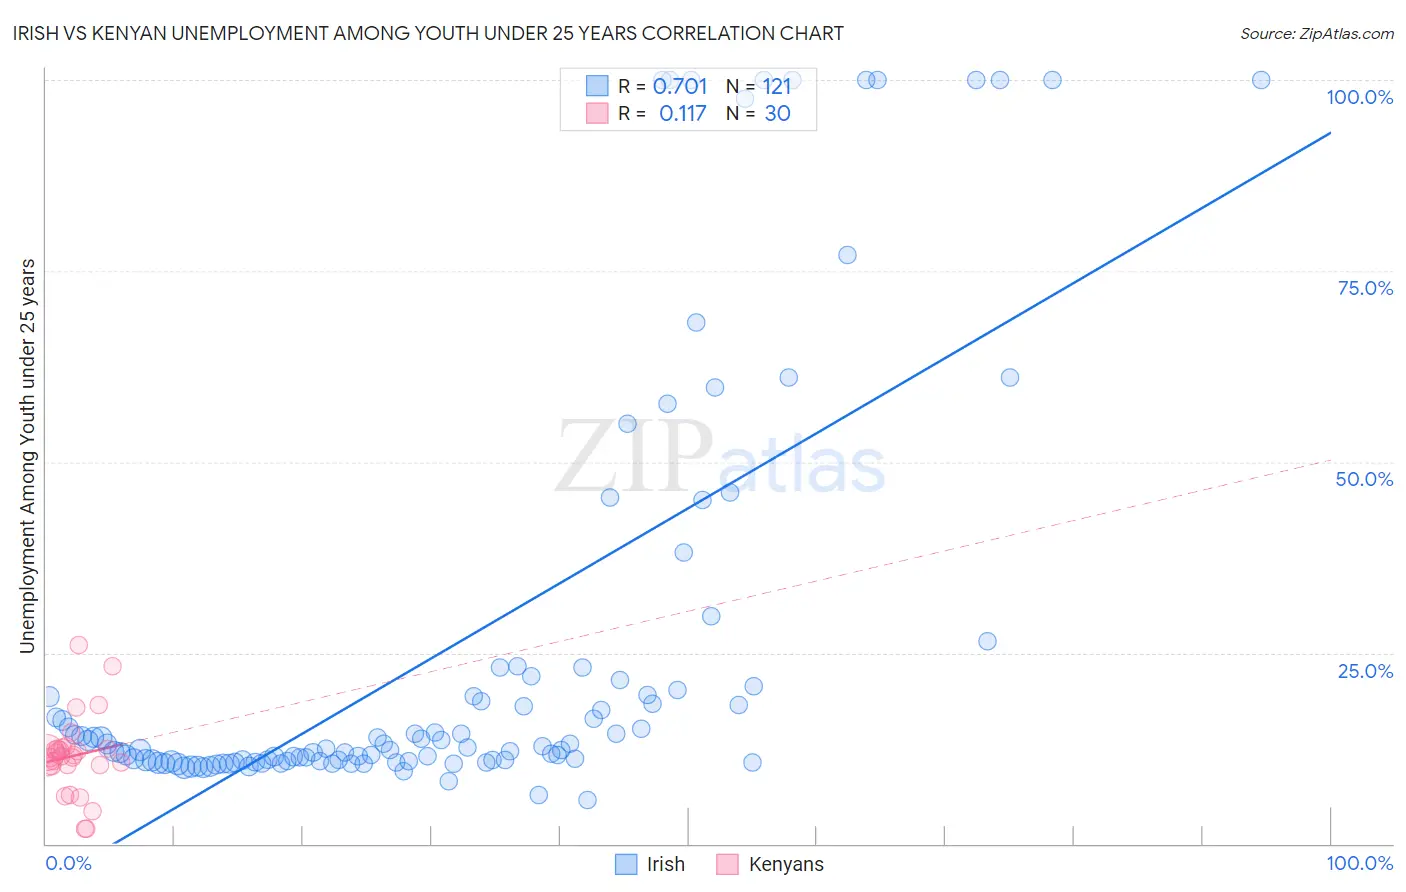
Irish vs Kenyan Unemployment Among Youth under 25 years Correlation Chart

The statistical analysis conducted on geographies consisting of 552,162,368 people shows a strong positive correlation between the proportion of Irish and unemployment rate among youth under the age of 25 in the United States with a correlation coefficient (R) of 0.701 and weighted average of 11.1%. Similarly, the statistical analysis conducted on geographies consisting of 167,662,123 people shows a poor positive correlation between the proportion of Kenyans and unemployment rate among youth under the age of 25 in the United States with a correlation coefficient (R) of 0.117 and weighted average of 11.2%, a difference of 1.5%.
Irish vs Kenyan Unemployment Among Youth under 25 years

Unemployment Among Youth under 25 years Correlation Summary

MeasurementIrishKenyan
Minimum5.8%1.9%
Maximum100.0%26.0%
Range94.2%24.1%
Mean25.8%11.5%
Median12.7%11.5%
Interquartile 25% (IQ1)10.8%10.2%
Interquartile 75% (IQ3)21.1%12.5%
Interquartile Range (IQR)10.3%2.2%
Standard Deviation (Sample)28.0%5.2%
Standard Deviation (Population)27.9%5.1%

Similar Demographics by Unemployment Among Youth under 25 years

Demographics Similar to Irish by Unemployment Among Youth under 25 years

In terms of unemployment among youth under 25 years, the demographic groups most similar to Irish are Mongolian (11.1%, a difference of 0.0%), Immigrants from Saudi Arabia (11.1%, a difference of 0.020%), Immigrants from Eritrea (11.1%, a difference of 0.030%), Scotch-Irish (11.1%, a difference of 0.070%), and Ottawa (11.1%, a difference of 0.090%).
DemographicsRating | RankUnemployment Among Youth under 25 years
Poles
99.3
/100
|
#48
Exceptional
11.0%
Thais
99.3
/100
|
#49
Exceptional
11.0%
Czechoslovakians
99.2
/100
|
#50
Exceptional
11.0%
Serbians
99.0
/100
|
#51
Exceptional
11.0%
Latvians
99.0
/100
|
#52
Exceptional
11.0%
Ottawa
99.0
/100
|
#53
Exceptional
11.1%
Mongolians
98.9
/100
|
#54
Exceptional
11.1%
Irish
98.9
/100
|
#55
Exceptional
11.1%
Immigrants | Saudi Arabia
98.8
/100
|
#56
Exceptional
11.1%
Immigrants | Eritrea
98.8
/100
|
#57
Exceptional
11.1%
Scotch-Irish
98.8
/100
|
#58
Exceptional
11.1%
Immigrants | Eastern Africa
98.7
/100
|
#59
Exceptional
11.1%
South Africans
98.5
/100
|
#60
Exceptional
11.1%
Filipinos
98.3
/100
|
#61
Exceptional
11.1%
Immigrants | Netherlands
98.1
/100
|
#62
Exceptional
11.1%

Demographics Similar to Kenyans by Unemployment Among Youth under 25 years

In terms of unemployment among youth under 25 years, the demographic groups most similar to Kenyans are Immigrants from South Africa (11.2%, a difference of 0.010%), Immigrants from South Central Asia (11.2%, a difference of 0.040%), French Canadian (11.2%, a difference of 0.050%), Austrian (11.2%, a difference of 0.050%), and Immigrants from Japan (11.2%, a difference of 0.060%).
DemographicsRating | RankUnemployment Among Youth under 25 years
Immigrants | Bulgaria
96.4
/100
|
#80
Exceptional
11.2%
Icelanders
96.3
/100
|
#81
Exceptional
11.2%
Northern Europeans
96.2
/100
|
#82
Exceptional
11.2%
Bolivians
96.1
/100
|
#83
Exceptional
11.2%
French Canadians
95.9
/100
|
#84
Exceptional
11.2%
Immigrants | South Central Asia
95.9
/100
|
#85
Exceptional
11.2%
Immigrants | South Africa
95.8
/100
|
#86
Exceptional
11.2%
Kenyans
95.7
/100
|
#87
Exceptional
11.2%
Austrians
95.5
/100
|
#88
Exceptional
11.2%
Immigrants | Japan
95.5
/100
|
#89
Exceptional
11.2%
Immigrants | Bolivia
95.5
/100
|
#90
Exceptional
11.2%
Immigrants | Taiwan
95.1
/100
|
#91
Exceptional
11.2%
Immigrants | Latvia
95.1
/100
|
#92
Exceptional
11.2%
Immigrants | North America
95.1
/100
|
#93
Exceptional
11.2%
Lithuanians
94.8
/100
|
#94
Exceptional
11.3%