Immigrants from Liberia vs Immigrants from Burma/Myanmar Unemployment
COMPARE
Immigrants from Liberia
Immigrants from Burma/Myanmar
Unemployment
Unemployment Comparison
Immigrants from Liberia
Immigrants from Burma/Myanmar
5.8%
UNEMPLOYMENT
0.1/ 100
METRIC RATING
264th/ 347
METRIC RANK
5.1%
UNEMPLOYMENT
86.2/ 100
METRIC RATING
135th/ 347
METRIC RANK
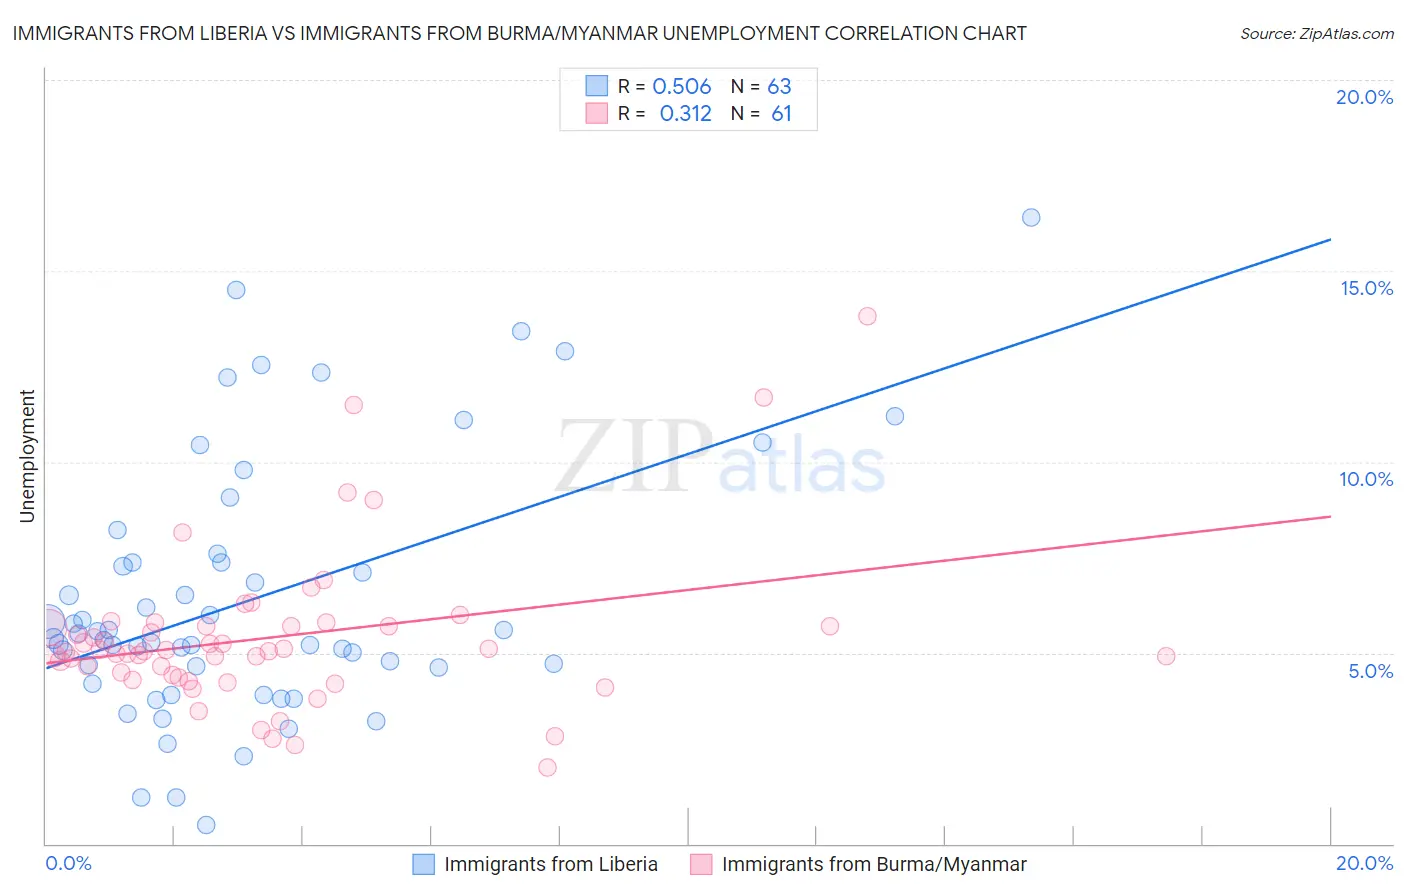
Immigrants from Liberia vs Immigrants from Burma/Myanmar Unemployment Correlation Chart
The statistical analysis conducted on geographies consisting of 135,254,533 people shows a substantial positive correlation between the proportion of Immigrants from Liberia and unemployment in the United States with a correlation coefficient (R) of 0.506 and weighted average of 5.8%. Similarly, the statistical analysis conducted on geographies consisting of 172,291,734 people shows a mild positive correlation between the proportion of Immigrants from Burma/Myanmar and unemployment in the United States with a correlation coefficient (R) of 0.312 and weighted average of 5.1%, a difference of 13.7%.
Unemployment Correlation Summary
| Measurement | Immigrants from Liberia | Immigrants from Burma/Myanmar |
| Minimum | 0.50% | 2.0% |
| Maximum | 16.4% | 13.8% |
| Range | 15.9% | 11.8% |
| Mean | 6.4% | 5.4% |
| Median | 5.4% | 5.0% |
| Interquartile 25% (IQ1) | 4.6% | 4.4% |
| Interquartile 75% (IQ3) | 7.4% | 5.7% |
| Interquartile Range (IQR) | 2.8% | 1.3% |
| Standard Deviation (Sample) | 3.4% | 2.1% |
| Standard Deviation (Population) | 3.3% | 2.0% |
Similar Demographics by Unemployment
Demographics Similar to Immigrants from Liberia by Unemployment
In terms of unemployment, the demographic groups most similar to Immigrants from Liberia are Nigerian (5.8%, a difference of 0.070%), Salvadoran (5.8%, a difference of 0.090%), Sierra Leonean (5.8%, a difference of 0.13%), Immigrants from Guatemala (5.8%, a difference of 0.23%), and Immigrants from Uzbekistan (5.8%, a difference of 0.25%).
| Demographics | Rating | Rank | Unemployment |
| Yaqui | 0.2 /100 | #257 | Tragic 5.8% |
| Immigrants | Bahamas | 0.1 /100 | #258 | Tragic 5.8% |
| Sub-Saharan Africans | 0.1 /100 | #259 | Tragic 5.8% |
| Immigrants | Uzbekistan | 0.1 /100 | #260 | Tragic 5.8% |
| Immigrants | Guatemala | 0.1 /100 | #261 | Tragic 5.8% |
| Sierra Leoneans | 0.1 /100 | #262 | Tragic 5.8% |
| Salvadorans | 0.1 /100 | #263 | Tragic 5.8% |
| Immigrants | Liberia | 0.1 /100 | #264 | Tragic 5.8% |
| Nigerians | 0.1 /100 | #265 | Tragic 5.8% |
| Mexican American Indians | 0.1 /100 | #266 | Tragic 5.8% |
| Immigrants | Nigeria | 0.1 /100 | #267 | Tragic 5.8% |
| Immigrants | Sierra Leone | 0.1 /100 | #268 | Tragic 5.8% |
| Immigrants | El Salvador | 0.1 /100 | #269 | Tragic 5.8% |
| Blackfeet | 0.1 /100 | #270 | Tragic 5.8% |
| Mexicans | 0.1 /100 | #271 | Tragic 5.9% |
Demographics Similar to Immigrants from Burma/Myanmar by Unemployment
In terms of unemployment, the demographic groups most similar to Immigrants from Burma/Myanmar are Immigrants from Europe (5.1%, a difference of 0.010%), Immigrants from Spain (5.1%, a difference of 0.010%), Immigrants from Jordan (5.1%, a difference of 0.050%), Immigrants from Ethiopia (5.1%, a difference of 0.060%), and Immigrants from Croatia (5.1%, a difference of 0.070%).
| Demographics | Rating | Rank | Unemployment |
| Immigrants | Eastern Africa | 88.1 /100 | #128 | Excellent 5.1% |
| Immigrants | Latvia | 88.0 /100 | #129 | Excellent 5.1% |
| Iranians | 86.9 /100 | #130 | Excellent 5.1% |
| Immigrants | Croatia | 86.8 /100 | #131 | Excellent 5.1% |
| Immigrants | Ethiopia | 86.7 /100 | #132 | Excellent 5.1% |
| Immigrants | Jordan | 86.6 /100 | #133 | Excellent 5.1% |
| Immigrants | Europe | 86.3 /100 | #134 | Excellent 5.1% |
| Immigrants | Burma/Myanmar | 86.2 /100 | #135 | Excellent 5.1% |
| Immigrants | Spain | 86.2 /100 | #136 | Excellent 5.1% |
| Immigrants | Saudi Arabia | 85.6 /100 | #137 | Excellent 5.1% |
| Immigrants | Hungary | 85.6 /100 | #138 | Excellent 5.1% |
| Pakistanis | 85.3 /100 | #139 | Excellent 5.1% |
| Immigrants | Denmark | 84.3 /100 | #140 | Excellent 5.1% |
| Palestinians | 83.4 /100 | #141 | Excellent 5.1% |
| Immigrants | Pakistan | 83.2 /100 | #142 | Excellent 5.1% |