Immigrants from Liberia vs Immigrants from Burma/Myanmar College, 1 year or more
COMPARE
Immigrants from Liberia
Immigrants from Burma/Myanmar
College, 1 year or more
College, 1 year or more Comparison
Immigrants from Liberia
Immigrants from Burma/Myanmar
55.7%
COLLEGE, 1 YEAR OR MORE
0.8/ 100
METRIC RATING
245th/ 347
METRIC RANK
56.6%
COLLEGE, 1 YEAR OR MORE
2.7/ 100
METRIC RATING
231st/ 347
METRIC RANK
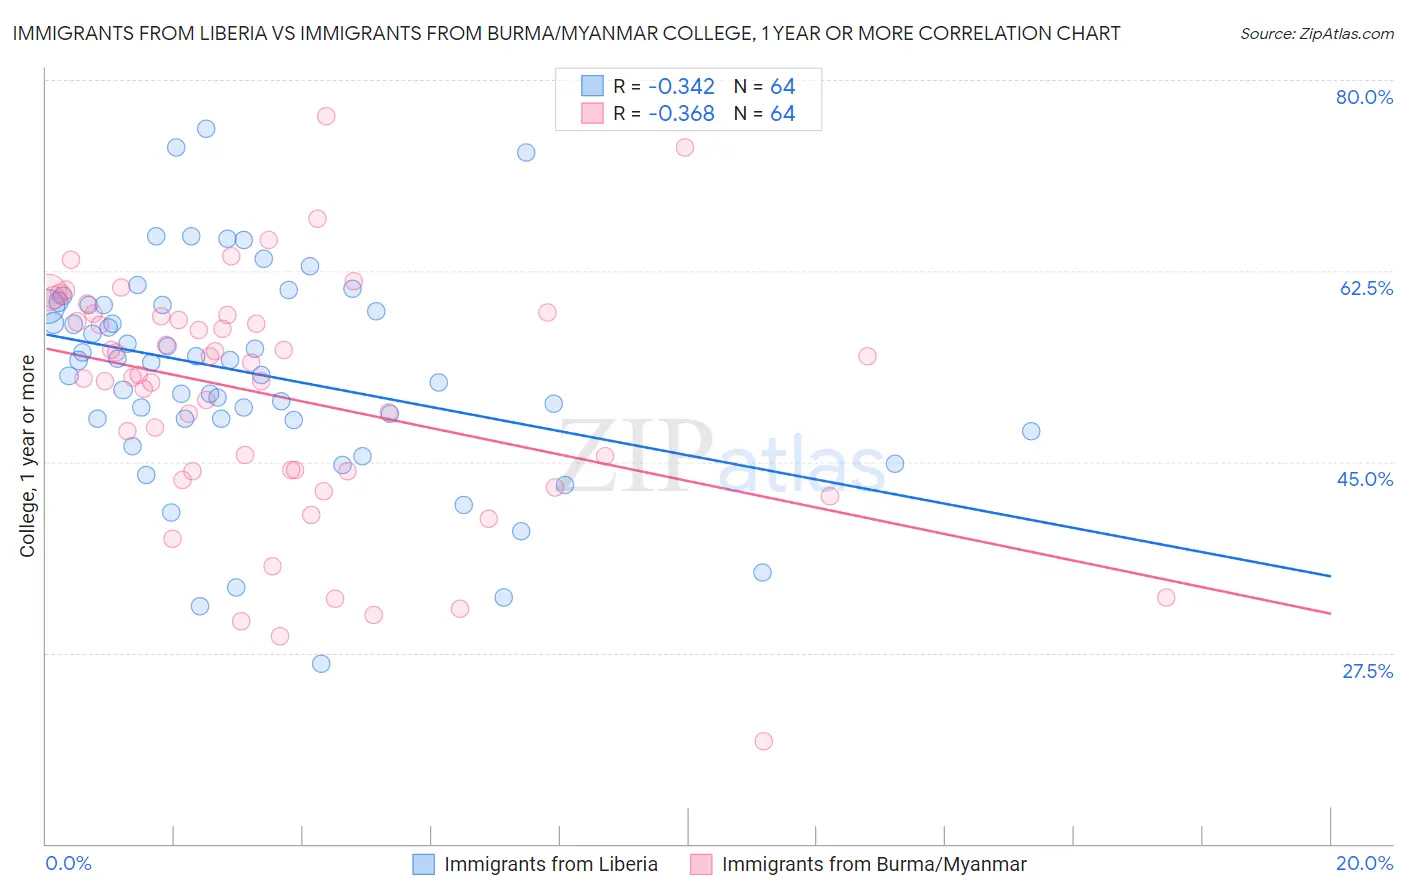
Immigrants from Liberia vs Immigrants from Burma/Myanmar College, 1 year or more Correlation Chart
The statistical analysis conducted on geographies consisting of 135,295,665 people shows a mild negative correlation between the proportion of Immigrants from Liberia and percentage of population with at least college, 1 year or more education in the United States with a correlation coefficient (R) of -0.342 and weighted average of 55.7%. Similarly, the statistical analysis conducted on geographies consisting of 172,357,706 people shows a mild negative correlation between the proportion of Immigrants from Burma/Myanmar and percentage of population with at least college, 1 year or more education in the United States with a correlation coefficient (R) of -0.368 and weighted average of 56.6%, a difference of 1.7%.
College, 1 year or more Correlation Summary
| Measurement | Immigrants from Liberia | Immigrants from Burma/Myanmar |
| Minimum | 26.5% | 19.4% |
| Maximum | 75.6% | 76.7% |
| Range | 49.1% | 57.3% |
| Mean | 53.1% | 51.0% |
| Median | 54.2% | 52.9% |
| Interquartile 25% (IQ1) | 48.9% | 44.1% |
| Interquartile 75% (IQ3) | 59.4% | 58.4% |
| Interquartile Range (IQR) | 10.5% | 14.3% |
| Standard Deviation (Sample) | 9.9% | 11.1% |
| Standard Deviation (Population) | 9.8% | 11.1% |
Demographics Similar to Immigrants from Liberia and Immigrants from Burma/Myanmar by College, 1 year or more
In terms of college, 1 year or more, the demographic groups most similar to Immigrants from Liberia are Malaysian (55.6%, a difference of 0.050%), Chippewa (55.7%, a difference of 0.070%), Hawaiian (55.6%, a difference of 0.12%), Immigrants from Congo (55.6%, a difference of 0.16%), and Osage (55.8%, a difference of 0.19%). Similarly, the demographic groups most similar to Immigrants from Burma/Myanmar are Immigrants from Bangladesh (56.6%, a difference of 0.060%), Nonimmigrants (56.5%, a difference of 0.15%), Liberian (56.7%, a difference of 0.19%), Cree (56.8%, a difference of 0.41%), and Immigrants from Fiji (56.9%, a difference of 0.54%).
| Demographics | Rating | Rank | College, 1 year or more |
| Immigrants | Fiji | 4.0 /100 | #228 | Tragic 56.9% |
| Cree | 3.6 /100 | #229 | Tragic 56.8% |
| Liberians | 3.1 /100 | #230 | Tragic 56.7% |
| Immigrants | Burma/Myanmar | 2.7 /100 | #231 | Tragic 56.6% |
| Immigrants | Bangladesh | 2.6 /100 | #232 | Tragic 56.6% |
| Immigrants | Nonimmigrants | 2.5 /100 | #233 | Tragic 56.5% |
| Spanish Americans | 1.8 /100 | #234 | Tragic 56.3% |
| West Indians | 1.8 /100 | #235 | Tragic 56.3% |
| Iroquois | 1.7 /100 | #236 | Tragic 56.2% |
| Samoans | 1.6 /100 | #237 | Tragic 56.2% |
| Barbadians | 1.3 /100 | #238 | Tragic 56.0% |
| Puget Sound Salish | 1.1 /100 | #239 | Tragic 55.9% |
| Trinidadians and Tobagonians | 1.1 /100 | #240 | Tragic 55.8% |
| French American Indians | 1.0 /100 | #241 | Tragic 55.8% |
| Marshallese | 1.0 /100 | #242 | Tragic 55.8% |
| Osage | 1.0 /100 | #243 | Tragic 55.8% |
| Chippewa | 0.9 /100 | #244 | Tragic 55.7% |
| Immigrants | Liberia | 0.8 /100 | #245 | Tragic 55.7% |
| Malaysians | 0.8 /100 | #246 | Tragic 55.6% |
| Hawaiians | 0.8 /100 | #247 | Tragic 55.6% |
| Immigrants | Congo | 0.8 /100 | #248 | Tragic 55.6% |