Immigrants from Latvia vs Houma Unemployment Among Ages 60 to 64 years
COMPARE
Immigrants from Latvia
Houma
Unemployment Among Ages 60 to 64 years
Unemployment Among Ages 60 to 64 years Comparison
Immigrants from Latvia
Houma
4.9%
UNEMPLOYMENT AMONG AGES 60 TO 64 YEARS
46.9/ 100
METRIC RATING
175th/ 347
METRIC RANK
4.9%
UNEMPLOYMENT AMONG AGES 60 TO 64 YEARS
28.3/ 100
METRIC RATING
193rd/ 347
METRIC RANK
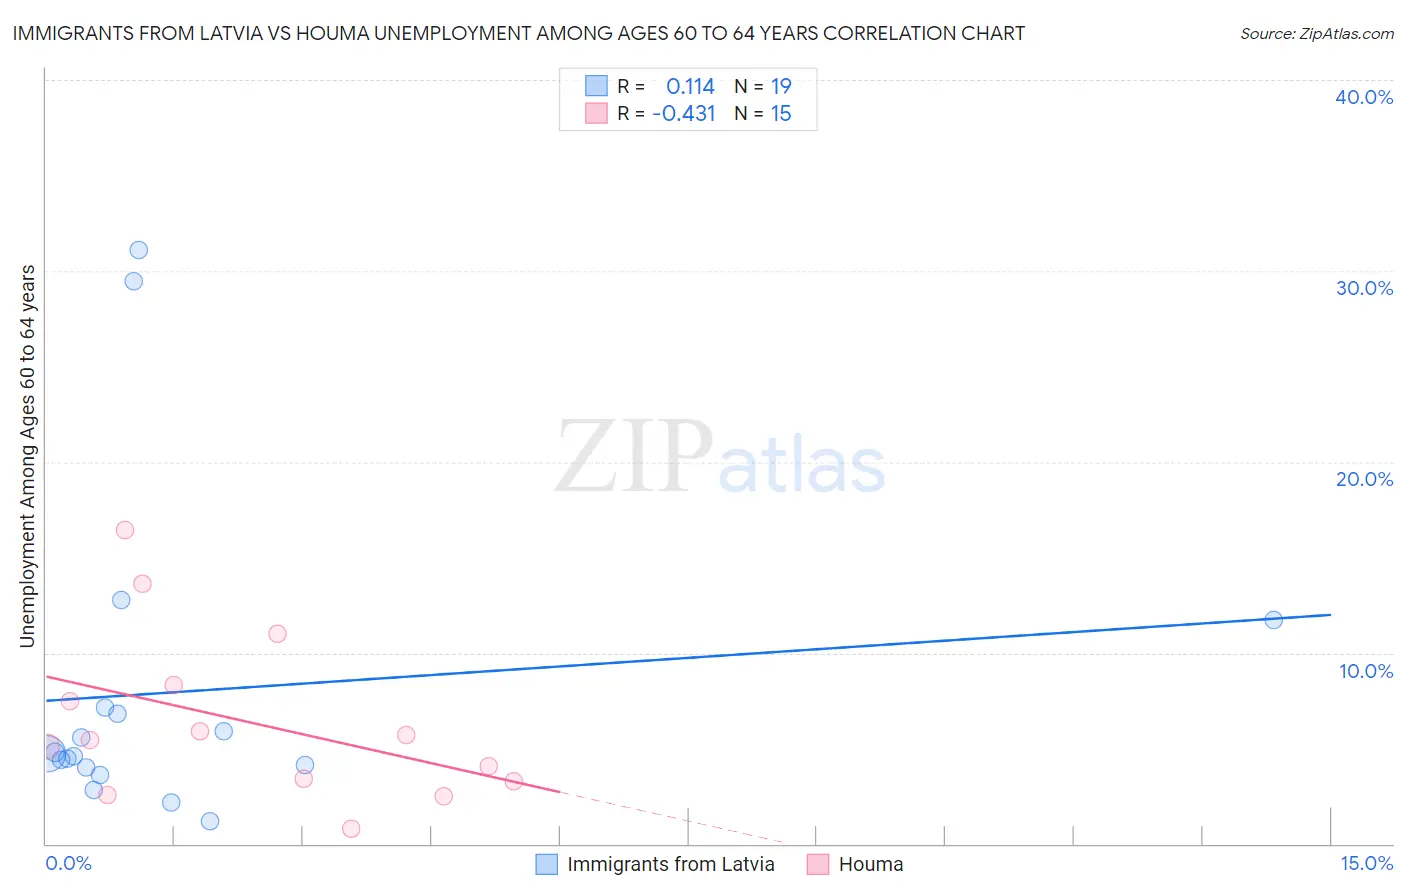
Immigrants from Latvia vs Houma Unemployment Among Ages 60 to 64 years Correlation Chart
The statistical analysis conducted on geographies consisting of 110,048,532 people shows a poor positive correlation between the proportion of Immigrants from Latvia and unemployment rate among population between the ages 60 and 64 in the United States with a correlation coefficient (R) of 0.114 and weighted average of 4.9%. Similarly, the statistical analysis conducted on geographies consisting of 35,391,990 people shows a moderate negative correlation between the proportion of Houma and unemployment rate among population between the ages 60 and 64 in the United States with a correlation coefficient (R) of -0.431 and weighted average of 4.9%, a difference of 0.71%.
Unemployment Among Ages 60 to 64 years Correlation Summary
| Measurement | Immigrants from Latvia | Houma |
| Minimum | 1.2% | 0.80% |
| Maximum | 31.1% | 16.4% |
| Range | 29.9% | 15.6% |
| Mean | 8.0% | 6.4% |
| Median | 4.7% | 5.4% |
| Interquartile 25% (IQ1) | 4.0% | 3.3% |
| Interquartile 75% (IQ3) | 7.1% | 8.3% |
| Interquartile Range (IQR) | 3.1% | 5.0% |
| Standard Deviation (Sample) | 8.4% | 4.4% |
| Standard Deviation (Population) | 8.1% | 4.2% |
Demographics Similar to Immigrants from Latvia and Houma by Unemployment Among Ages 60 to 64 years
In terms of unemployment among ages 60 to 64 years, the demographic groups most similar to Immigrants from Latvia are Bermudan (4.9%, a difference of 0.010%), Immigrants from Malaysia (4.9%, a difference of 0.080%), Nonimmigrants (4.9%, a difference of 0.080%), Immigrants from Sweden (4.9%, a difference of 0.090%), and Immigrants from Western Europe (4.9%, a difference of 0.11%). Similarly, the demographic groups most similar to Houma are Menominee (4.9%, a difference of 0.020%), Immigrants from Nigeria (4.9%, a difference of 0.050%), Immigrants from Nicaragua (4.9%, a difference of 0.060%), Immigrants from Europe (4.9%, a difference of 0.060%), and Immigrants from Colombia (4.9%, a difference of 0.070%).
| Demographics | Rating | Rank | Unemployment Among Ages 60 to 64 years |
| Immigrants | Western Europe | 50.0 /100 | #174 | Average 4.9% |
| Immigrants | Latvia | 46.9 /100 | #175 | Average 4.9% |
| Bermudans | 46.5 /100 | #176 | Average 4.9% |
| Immigrants | Malaysia | 44.7 /100 | #177 | Average 4.9% |
| Immigrants | Nonimmigrants | 44.5 /100 | #178 | Average 4.9% |
| Immigrants | Sweden | 44.3 /100 | #179 | Average 4.9% |
| Asians | 40.8 /100 | #180 | Average 4.9% |
| Hungarians | 40.6 /100 | #181 | Average 4.9% |
| Sri Lankans | 39.8 /100 | #182 | Fair 4.9% |
| Sub-Saharan Africans | 38.9 /100 | #183 | Fair 4.9% |
| Immigrants | Ukraine | 37.6 /100 | #184 | Fair 4.9% |
| Ute | 37.4 /100 | #185 | Fair 4.9% |
| Spaniards | 35.8 /100 | #186 | Fair 4.9% |
| South American Indians | 31.2 /100 | #187 | Fair 4.9% |
| Nicaraguans | 30.4 /100 | #188 | Fair 4.9% |
| Immigrants | Nicaragua | 29.8 /100 | #189 | Fair 4.9% |
| Immigrants | Europe | 29.8 /100 | #190 | Fair 4.9% |
| Immigrants | Nigeria | 29.6 /100 | #191 | Fair 4.9% |
| Menominee | 28.8 /100 | #192 | Fair 4.9% |
| Houma | 28.3 /100 | #193 | Fair 4.9% |
| Immigrants | Colombia | 26.8 /100 | #194 | Fair 4.9% |