Immigrants from Latvia vs Carpatho Rusyn Unemployment Among Ages 60 to 64 years
COMPARE
Immigrants from Latvia
Carpatho Rusyn
Unemployment Among Ages 60 to 64 years
Unemployment Among Ages 60 to 64 years Comparison
Immigrants from Latvia
Carpatho Rusyns
4.9%
UNEMPLOYMENT AMONG AGES 60 TO 64 YEARS
46.9/ 100
METRIC RATING
175th/ 347
METRIC RANK
4.5%
UNEMPLOYMENT AMONG AGES 60 TO 64 YEARS
100.0/ 100
METRIC RATING
33rd/ 347
METRIC RANK
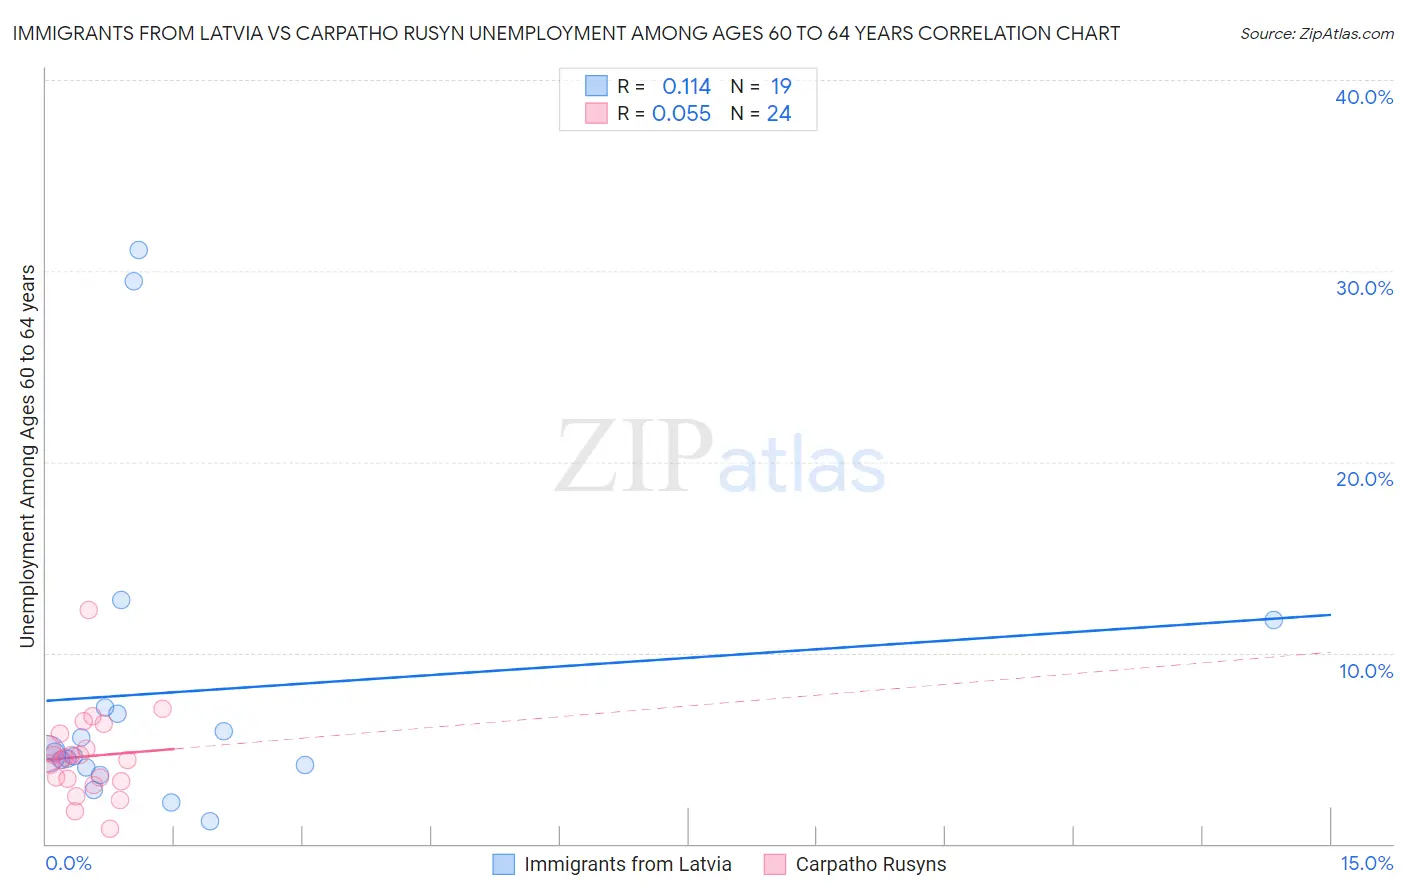
Immigrants from Latvia vs Carpatho Rusyn Unemployment Among Ages 60 to 64 years Correlation Chart
The statistical analysis conducted on geographies consisting of 110,048,532 people shows a poor positive correlation between the proportion of Immigrants from Latvia and unemployment rate among population between the ages 60 and 64 in the United States with a correlation coefficient (R) of 0.114 and weighted average of 4.9%. Similarly, the statistical analysis conducted on geographies consisting of 57,468,302 people shows a slight positive correlation between the proportion of Carpatho Rusyns and unemployment rate among population between the ages 60 and 64 in the United States with a correlation coefficient (R) of 0.055 and weighted average of 4.5%, a difference of 8.7%.
Unemployment Among Ages 60 to 64 years Correlation Summary
| Measurement | Immigrants from Latvia | Carpatho Rusyn |
| Minimum | 1.2% | 0.80% |
| Maximum | 31.1% | 12.2% |
| Range | 29.9% | 11.4% |
| Mean | 8.0% | 4.6% |
| Median | 4.7% | 4.5% |
| Interquartile 25% (IQ1) | 4.0% | 3.3% |
| Interquartile 75% (IQ3) | 7.1% | 5.4% |
| Interquartile Range (IQR) | 3.1% | 2.0% |
| Standard Deviation (Sample) | 8.4% | 2.3% |
| Standard Deviation (Population) | 8.1% | 2.2% |
Similar Demographics by Unemployment Among Ages 60 to 64 years
Demographics Similar to Immigrants from Latvia by Unemployment Among Ages 60 to 64 years
In terms of unemployment among ages 60 to 64 years, the demographic groups most similar to Immigrants from Latvia are Bermudan (4.9%, a difference of 0.010%), Immigrants from Malaysia (4.9%, a difference of 0.080%), Nonimmigrants (4.9%, a difference of 0.080%), Immigrants from Sweden (4.9%, a difference of 0.090%), and Immigrants from Western Europe (4.9%, a difference of 0.11%).
| Demographics | Rating | Rank | Unemployment Among Ages 60 to 64 years |
| Immigrants | Southern Europe | 56.7 /100 | #168 | Average 4.8% |
| Immigrants | France | 55.5 /100 | #169 | Average 4.8% |
| Immigrants | Korea | 54.2 /100 | #170 | Average 4.8% |
| Samoans | 53.6 /100 | #171 | Average 4.9% |
| Immigrants | Turkey | 52.8 /100 | #172 | Average 4.9% |
| Immigrants | Hungary | 50.2 /100 | #173 | Average 4.9% |
| Immigrants | Western Europe | 50.0 /100 | #174 | Average 4.9% |
| Immigrants | Latvia | 46.9 /100 | #175 | Average 4.9% |
| Bermudans | 46.5 /100 | #176 | Average 4.9% |
| Immigrants | Malaysia | 44.7 /100 | #177 | Average 4.9% |
| Immigrants | Nonimmigrants | 44.5 /100 | #178 | Average 4.9% |
| Immigrants | Sweden | 44.3 /100 | #179 | Average 4.9% |
| Asians | 40.8 /100 | #180 | Average 4.9% |
| Hungarians | 40.6 /100 | #181 | Average 4.9% |
| Sri Lankans | 39.8 /100 | #182 | Fair 4.9% |
Demographics Similar to Carpatho Rusyns by Unemployment Among Ages 60 to 64 years
In terms of unemployment among ages 60 to 64 years, the demographic groups most similar to Carpatho Rusyns are Zimbabwean (4.5%, a difference of 0.050%), Immigrants from Eritrea (4.5%, a difference of 0.090%), Immigrants from Venezuela (4.5%, a difference of 0.16%), Cuban (4.5%, a difference of 0.18%), and Belgian (4.5%, a difference of 0.26%).
| Demographics | Rating | Rank | Unemployment Among Ages 60 to 64 years |
| Czechs | 100.0 /100 | #26 | Exceptional 4.4% |
| Immigrants | Iraq | 100.0 /100 | #27 | Exceptional 4.5% |
| Immigrants | Nepal | 100.0 /100 | #28 | Exceptional 4.5% |
| Cubans | 100.0 /100 | #29 | Exceptional 4.5% |
| Immigrants | Venezuela | 100.0 /100 | #30 | Exceptional 4.5% |
| Immigrants | Eritrea | 100.0 /100 | #31 | Exceptional 4.5% |
| Zimbabweans | 100.0 /100 | #32 | Exceptional 4.5% |
| Carpatho Rusyns | 100.0 /100 | #33 | Exceptional 4.5% |
| Belgians | 100.0 /100 | #34 | Exceptional 4.5% |
| Germans | 100.0 /100 | #35 | Exceptional 4.5% |
| Venezuelans | 100.0 /100 | #36 | Exceptional 4.5% |
| Immigrants | Portugal | 100.0 /100 | #37 | Exceptional 4.5% |
| Native Hawaiians | 100.0 /100 | #38 | Exceptional 4.5% |
| Iraqis | 100.0 /100 | #39 | Exceptional 4.5% |
| Scandinavians | 100.0 /100 | #40 | Exceptional 4.5% |