Immigrants from Latvia vs Immigrants from Southern Europe Unemployment Among Ages 60 to 64 years
COMPARE
Immigrants from Latvia
Immigrants from Southern Europe
Unemployment Among Ages 60 to 64 years
Unemployment Among Ages 60 to 64 years Comparison
Immigrants from Latvia
Immigrants from Southern Europe
4.9%
UNEMPLOYMENT AMONG AGES 60 TO 64 YEARS
46.9/ 100
METRIC RATING
175th/ 347
METRIC RANK
4.8%
UNEMPLOYMENT AMONG AGES 60 TO 64 YEARS
56.7/ 100
METRIC RATING
168th/ 347
METRIC RANK
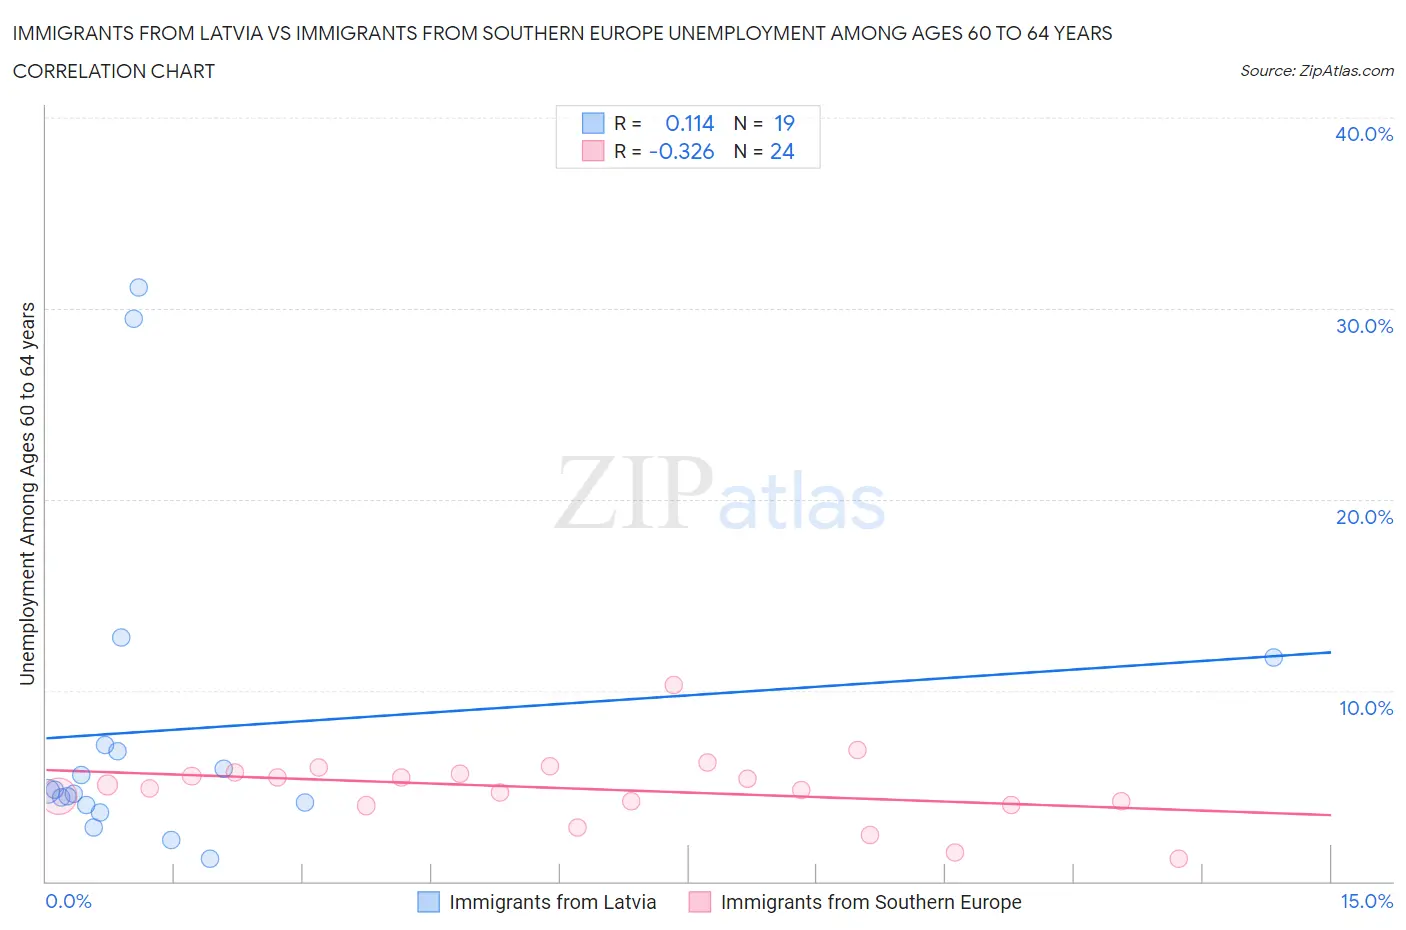
Immigrants from Latvia vs Immigrants from Southern Europe Unemployment Among Ages 60 to 64 years Correlation Chart
The statistical analysis conducted on geographies consisting of 110,048,532 people shows a poor positive correlation between the proportion of Immigrants from Latvia and unemployment rate among population between the ages 60 and 64 in the United States with a correlation coefficient (R) of 0.114 and weighted average of 4.9%. Similarly, the statistical analysis conducted on geographies consisting of 365,506,927 people shows a mild negative correlation between the proportion of Immigrants from Southern Europe and unemployment rate among population between the ages 60 and 64 in the United States with a correlation coefficient (R) of -0.326 and weighted average of 4.8%, a difference of 0.35%.
Unemployment Among Ages 60 to 64 years Correlation Summary
| Measurement | Immigrants from Latvia | Immigrants from Southern Europe |
| Minimum | 1.2% | 1.2% |
| Maximum | 31.1% | 10.3% |
| Range | 29.9% | 9.1% |
| Mean | 8.0% | 4.9% |
| Median | 4.7% | 5.0% |
| Interquartile 25% (IQ1) | 4.0% | 4.1% |
| Interquartile 75% (IQ3) | 7.1% | 5.7% |
| Interquartile Range (IQR) | 3.1% | 1.6% |
| Standard Deviation (Sample) | 8.4% | 1.8% |
| Standard Deviation (Population) | 8.1% | 1.8% |
Demographics Similar to Immigrants from Latvia and Immigrants from Southern Europe by Unemployment Among Ages 60 to 64 years
In terms of unemployment among ages 60 to 64 years, the demographic groups most similar to Immigrants from Latvia are Bermudan (4.9%, a difference of 0.010%), Immigrants from Malaysia (4.9%, a difference of 0.080%), Nonimmigrants (4.9%, a difference of 0.080%), Immigrants from Sweden (4.9%, a difference of 0.090%), and Immigrants from Western Europe (4.9%, a difference of 0.11%). Similarly, the demographic groups most similar to Immigrants from Southern Europe are Immigrants from France (4.8%, a difference of 0.040%), Immigrants from Northern Europe (4.8%, a difference of 0.090%), Immigrants from Korea (4.8%, a difference of 0.090%), Samoan (4.9%, a difference of 0.11%), and Palestinian (4.8%, a difference of 0.14%).
| Demographics | Rating | Rank | Unemployment Among Ages 60 to 64 years |
| Immigrants | Norway | 65.1 /100 | #161 | Good 4.8% |
| South Africans | 65.1 /100 | #162 | Good 4.8% |
| Immigrants | Belgium | 64.8 /100 | #163 | Good 4.8% |
| Pakistanis | 64.6 /100 | #164 | Good 4.8% |
| Immigrants | Panama | 62.0 /100 | #165 | Good 4.8% |
| Palestinians | 60.5 /100 | #166 | Good 4.8% |
| Immigrants | Northern Europe | 59.1 /100 | #167 | Average 4.8% |
| Immigrants | Southern Europe | 56.7 /100 | #168 | Average 4.8% |
| Immigrants | France | 55.5 /100 | #169 | Average 4.8% |
| Immigrants | Korea | 54.2 /100 | #170 | Average 4.8% |
| Samoans | 53.6 /100 | #171 | Average 4.9% |
| Immigrants | Turkey | 52.8 /100 | #172 | Average 4.9% |
| Immigrants | Hungary | 50.2 /100 | #173 | Average 4.9% |
| Immigrants | Western Europe | 50.0 /100 | #174 | Average 4.9% |
| Immigrants | Latvia | 46.9 /100 | #175 | Average 4.9% |
| Bermudans | 46.5 /100 | #176 | Average 4.9% |
| Immigrants | Malaysia | 44.7 /100 | #177 | Average 4.9% |
| Immigrants | Nonimmigrants | 44.5 /100 | #178 | Average 4.9% |
| Immigrants | Sweden | 44.3 /100 | #179 | Average 4.9% |
| Asians | 40.8 /100 | #180 | Average 4.9% |
| Hungarians | 40.6 /100 | #181 | Average 4.9% |