Immigrants from Latvia vs Houma Median Female Earnings
COMPARE
Immigrants from Latvia
Houma
Median Female Earnings
Median Female Earnings Comparison
Immigrants from Latvia
Houma
$43,099
MEDIAN FEMALE EARNINGS
99.9/ 100
METRIC RATING
60th/ 347
METRIC RANK
$30,343
MEDIAN FEMALE EARNINGS
0.0/ 100
METRIC RATING
347th/ 347
METRIC RANK
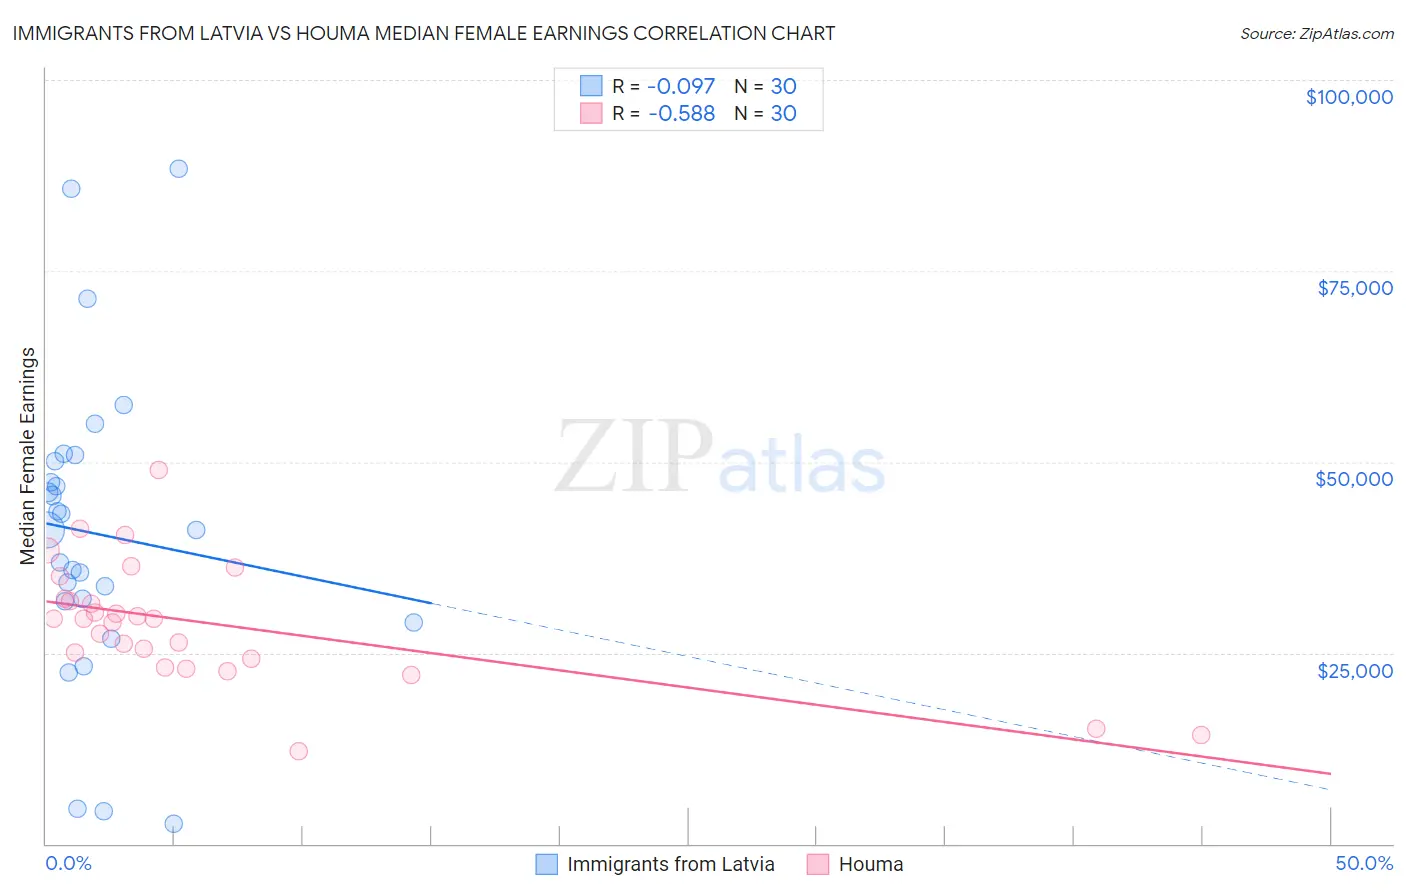
Immigrants from Latvia vs Houma Median Female Earnings Correlation Chart
The statistical analysis conducted on geographies consisting of 113,735,642 people shows a slight negative correlation between the proportion of Immigrants from Latvia and median female earnings in the United States with a correlation coefficient (R) of -0.097 and weighted average of $43,099. Similarly, the statistical analysis conducted on geographies consisting of 36,795,297 people shows a substantial negative correlation between the proportion of Houma and median female earnings in the United States with a correlation coefficient (R) of -0.588 and weighted average of $30,343, a difference of 42.0%.
Median Female Earnings Correlation Summary
| Measurement | Immigrants from Latvia | Houma |
| Minimum | $2,606 | $12,038 |
| Maximum | $88,365 | $48,900 |
| Range | $85,759 | $36,862 |
| Mean | $40,583 | $28,868 |
| Median | $41,080 | $29,403 |
| Interquartile 25% (IQ1) | $31,765 | $24,292 |
| Interquartile 75% (IQ3) | $50,109 | $32,114 |
| Interquartile Range (IQR) | $18,344 | $7,822 |
| Standard Deviation (Sample) | $19,932 | $8,016 |
| Standard Deviation (Population) | $19,597 | $7,881 |
Similar Demographics by Median Female Earnings
Demographics Similar to Immigrants from Latvia by Median Female Earnings
In terms of median female earnings, the demographic groups most similar to Immigrants from Latvia are Estonian ($43,106, a difference of 0.020%), Immigrants from Bulgaria ($43,085, a difference of 0.030%), Afghan ($43,077, a difference of 0.050%), Immigrants from Ukraine ($43,069, a difference of 0.070%), and Immigrants from Pakistan ($43,052, a difference of 0.11%).
| Demographics | Rating | Rank | Median Female Earnings |
| Immigrants | Eastern Europe | 99.9 /100 | #53 | Exceptional $43,309 |
| Australians | 99.9 /100 | #54 | Exceptional $43,308 |
| Egyptians | 99.9 /100 | #55 | Exceptional $43,305 |
| Immigrants | Croatia | 99.9 /100 | #56 | Exceptional $43,258 |
| Ethiopians | 99.9 /100 | #57 | Exceptional $43,243 |
| Paraguayans | 99.9 /100 | #58 | Exceptional $43,173 |
| Estonians | 99.9 /100 | #59 | Exceptional $43,106 |
| Immigrants | Latvia | 99.9 /100 | #60 | Exceptional $43,099 |
| Immigrants | Bulgaria | 99.9 /100 | #61 | Exceptional $43,085 |
| Afghans | 99.9 /100 | #62 | Exceptional $43,077 |
| Immigrants | Ukraine | 99.9 /100 | #63 | Exceptional $43,069 |
| Immigrants | Pakistan | 99.9 /100 | #64 | Exceptional $43,052 |
| Sierra Leoneans | 99.9 /100 | #65 | Exceptional $42,868 |
| Immigrants | Norway | 99.9 /100 | #66 | Exceptional $42,837 |
| Immigrants | Egypt | 99.9 /100 | #67 | Exceptional $42,837 |
Demographics Similar to Houma by Median Female Earnings
In terms of median female earnings, the demographic groups most similar to Houma are Arapaho ($31,489, a difference of 3.8%), Puerto Rican ($31,560, a difference of 4.0%), Lumbee ($32,500, a difference of 7.1%), Pueblo ($32,564, a difference of 7.3%), and Yup'ik ($32,730, a difference of 7.9%).
| Demographics | Rating | Rank | Median Female Earnings |
| Mexicans | 0.0 /100 | #333 | Tragic $33,664 |
| Spanish American Indians | 0.0 /100 | #334 | Tragic $33,625 |
| Creek | 0.0 /100 | #335 | Tragic $33,437 |
| Ottawa | 0.0 /100 | #336 | Tragic $33,378 |
| Yakama | 0.0 /100 | #337 | Tragic $33,354 |
| Immigrants | Cuba | 0.0 /100 | #338 | Tragic $33,291 |
| Immigrants | Mexico | 0.0 /100 | #339 | Tragic $33,236 |
| Tohono O'odham | 0.0 /100 | #340 | Tragic $33,205 |
| Navajo | 0.0 /100 | #341 | Tragic $33,046 |
| Yup'ik | 0.0 /100 | #342 | Tragic $32,730 |
| Pueblo | 0.0 /100 | #343 | Tragic $32,564 |
| Lumbee | 0.0 /100 | #344 | Tragic $32,500 |
| Puerto Ricans | 0.0 /100 | #345 | Tragic $31,560 |
| Arapaho | 0.0 /100 | #346 | Tragic $31,489 |
| Houma | 0.0 /100 | #347 | Tragic $30,343 |