Immigrants from Latvia vs Immigrants from Somalia Unemployment
COMPARE
Immigrants from Latvia
Immigrants from Somalia
Unemployment
Unemployment Comparison
Immigrants from Latvia
Immigrants from Somalia
5.1%
UNEMPLOYMENT
88.0/ 100
METRIC RATING
129th/ 347
METRIC RANK
5.3%
UNEMPLOYMENT
33.8/ 100
METRIC RATING
193rd/ 347
METRIC RANK
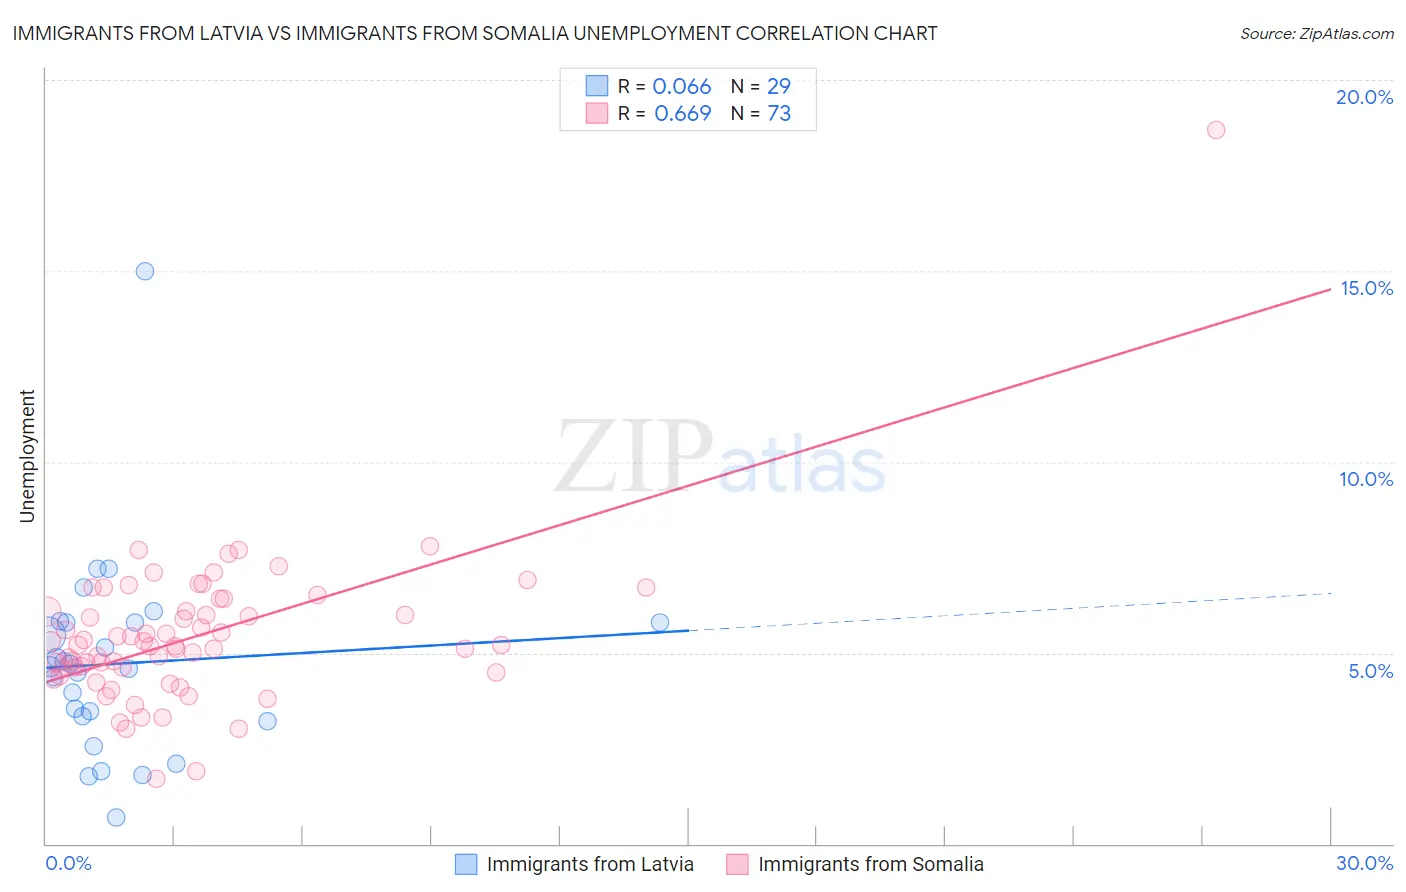
Immigrants from Latvia vs Immigrants from Somalia Unemployment Correlation Chart
The statistical analysis conducted on geographies consisting of 113,721,061 people shows a slight positive correlation between the proportion of Immigrants from Latvia and unemployment in the United States with a correlation coefficient (R) of 0.066 and weighted average of 5.1%. Similarly, the statistical analysis conducted on geographies consisting of 92,091,323 people shows a significant positive correlation between the proportion of Immigrants from Somalia and unemployment in the United States with a correlation coefficient (R) of 0.669 and weighted average of 5.3%, a difference of 4.2%.
Unemployment Correlation Summary
| Measurement | Immigrants from Latvia | Immigrants from Somalia |
| Minimum | 0.70% | 1.7% |
| Maximum | 15.0% | 18.7% |
| Range | 14.3% | 17.0% |
| Mean | 4.7% | 5.4% |
| Median | 4.6% | 5.2% |
| Interquartile 25% (IQ1) | 3.3% | 4.5% |
| Interquartile 75% (IQ3) | 5.8% | 6.2% |
| Interquartile Range (IQR) | 2.5% | 1.7% |
| Standard Deviation (Sample) | 2.6% | 2.1% |
| Standard Deviation (Population) | 2.6% | 2.0% |
Similar Demographics by Unemployment
Demographics Similar to Immigrants from Latvia by Unemployment
In terms of unemployment, the demographic groups most similar to Immigrants from Latvia are Immigrants from Eastern Africa (5.1%, a difference of 0.0%), Kenyan (5.1%, a difference of 0.020%), Immigrants from Kenya (5.1%, a difference of 0.020%), Immigrants from Eastern Asia (5.1%, a difference of 0.040%), and Ethiopian (5.1%, a difference of 0.090%).
| Demographics | Rating | Rank | Unemployment |
| Immigrants | Switzerland | 89.1 /100 | #122 | Excellent 5.1% |
| Asians | 89.0 /100 | #123 | Excellent 5.1% |
| Ethiopians | 88.6 /100 | #124 | Excellent 5.1% |
| Immigrants | Eastern Asia | 88.3 /100 | #125 | Excellent 5.1% |
| Kenyans | 88.2 /100 | #126 | Excellent 5.1% |
| Immigrants | Kenya | 88.2 /100 | #127 | Excellent 5.1% |
| Immigrants | Eastern Africa | 88.1 /100 | #128 | Excellent 5.1% |
| Immigrants | Latvia | 88.0 /100 | #129 | Excellent 5.1% |
| Iranians | 86.9 /100 | #130 | Excellent 5.1% |
| Immigrants | Croatia | 86.8 /100 | #131 | Excellent 5.1% |
| Immigrants | Ethiopia | 86.7 /100 | #132 | Excellent 5.1% |
| Immigrants | Jordan | 86.6 /100 | #133 | Excellent 5.1% |
| Immigrants | Europe | 86.3 /100 | #134 | Excellent 5.1% |
| Immigrants | Burma/Myanmar | 86.2 /100 | #135 | Excellent 5.1% |
| Immigrants | Spain | 86.2 /100 | #136 | Excellent 5.1% |
Demographics Similar to Immigrants from Somalia by Unemployment
In terms of unemployment, the demographic groups most similar to Immigrants from Somalia are Somali (5.3%, a difference of 0.010%), South American (5.3%, a difference of 0.010%), Arab (5.3%, a difference of 0.10%), Immigrants from Belarus (5.3%, a difference of 0.12%), and Immigrants from Laos (5.3%, a difference of 0.20%).
| Demographics | Rating | Rank | Unemployment |
| Immigrants | Uganda | 37.8 /100 | #186 | Fair 5.3% |
| Costa Ricans | 37.4 /100 | #187 | Fair 5.3% |
| Alsatians | 37.0 /100 | #188 | Fair 5.3% |
| Immigrants | Belarus | 35.6 /100 | #189 | Fair 5.3% |
| Arabs | 35.3 /100 | #190 | Fair 5.3% |
| Somalis | 34.0 /100 | #191 | Fair 5.3% |
| South Americans | 33.9 /100 | #192 | Fair 5.3% |
| Immigrants | Somalia | 33.8 /100 | #193 | Fair 5.3% |
| Immigrants | Laos | 30.9 /100 | #194 | Fair 5.3% |
| Immigrants | Southern Europe | 30.9 /100 | #195 | Fair 5.3% |
| Peruvians | 29.9 /100 | #196 | Fair 5.3% |
| Immigrants | Uruguay | 29.8 /100 | #197 | Fair 5.3% |
| Immigrants | Israel | 28.6 /100 | #198 | Fair 5.3% |
| Immigrants | Afghanistan | 28.6 /100 | #199 | Fair 5.3% |
| Koreans | 27.4 /100 | #200 | Fair 5.3% |