Immigrants from Latin America vs Kenyan Currently Married
COMPARE
Immigrants from Latin America
Kenyan
Currently Married
Currently Married Comparison
Immigrants from Latin America
Kenyans
43.8%
CURRENTLY MARRIED
0.1/ 100
METRIC RATING
260th/ 347
METRIC RANK
45.2%
CURRENTLY MARRIED
3.1/ 100
METRIC RATING
220th/ 347
METRIC RANK
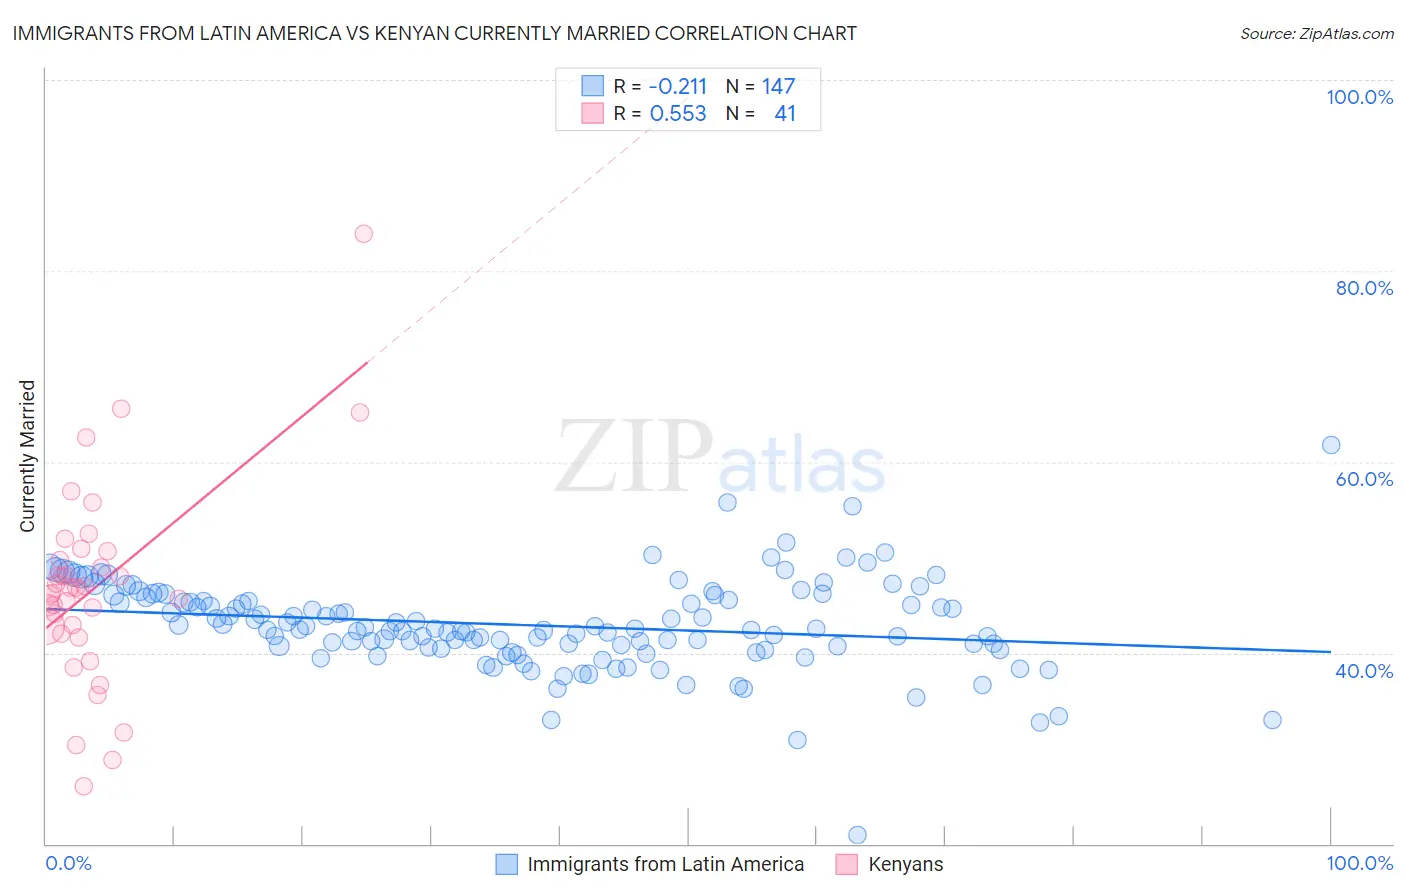
Immigrants from Latin America vs Kenyan Currently Married Correlation Chart
The statistical analysis conducted on geographies consisting of 558,538,971 people shows a weak negative correlation between the proportion of Immigrants from Latin America and percentage of population currently married in the United States with a correlation coefficient (R) of -0.211 and weighted average of 43.8%. Similarly, the statistical analysis conducted on geographies consisting of 168,238,911 people shows a substantial positive correlation between the proportion of Kenyans and percentage of population currently married in the United States with a correlation coefficient (R) of 0.553 and weighted average of 45.2%, a difference of 3.2%.
Currently Married Correlation Summary
| Measurement | Immigrants from Latin America | Kenyan |
| Minimum | 20.9% | 26.0% |
| Maximum | 61.8% | 83.9% |
| Range | 40.9% | 57.9% |
| Mean | 42.9% | 46.8% |
| Median | 42.5% | 46.5% |
| Interquartile 25% (IQ1) | 40.6% | 42.3% |
| Interquartile 75% (IQ3) | 45.8% | 50.1% |
| Interquartile Range (IQR) | 5.2% | 7.8% |
| Standard Deviation (Sample) | 4.8% | 10.4% |
| Standard Deviation (Population) | 4.8% | 10.3% |
Similar Demographics by Currently Married
Demographics Similar to Immigrants from Latin America by Currently Married
In terms of currently married, the demographic groups most similar to Immigrants from Latin America are Immigrants from Nicaragua (43.7%, a difference of 0.040%), Immigrants from Sierra Leone (43.8%, a difference of 0.060%), Bangladeshi (43.7%, a difference of 0.18%), Immigrants from Cuba (43.7%, a difference of 0.22%), and Sudanese (43.7%, a difference of 0.24%).
| Demographics | Rating | Rank | Currently Married |
| Immigrants | Central America | 0.3 /100 | #253 | Tragic 44.1% |
| Vietnamese | 0.2 /100 | #254 | Tragic 44.0% |
| Yakama | 0.2 /100 | #255 | Tragic 44.0% |
| Shoshone | 0.2 /100 | #256 | Tragic 44.0% |
| Immigrants | Africa | 0.2 /100 | #257 | Tragic 43.9% |
| Ute | 0.2 /100 | #258 | Tragic 43.9% |
| Immigrants | Sierra Leone | 0.1 /100 | #259 | Tragic 43.8% |
| Immigrants | Latin America | 0.1 /100 | #260 | Tragic 43.8% |
| Immigrants | Nicaragua | 0.1 /100 | #261 | Tragic 43.7% |
| Bangladeshis | 0.1 /100 | #262 | Tragic 43.7% |
| Immigrants | Cuba | 0.1 /100 | #263 | Tragic 43.7% |
| Sudanese | 0.1 /100 | #264 | Tragic 43.7% |
| Immigrants | Bangladesh | 0.1 /100 | #265 | Tragic 43.6% |
| Ecuadorians | 0.1 /100 | #266 | Tragic 43.6% |
| Immigrants | Eritrea | 0.1 /100 | #267 | Tragic 43.6% |
Demographics Similar to Kenyans by Currently Married
In terms of currently married, the demographic groups most similar to Kenyans are Mexican (45.2%, a difference of 0.020%), Immigrants from Portugal (45.2%, a difference of 0.13%), Immigrants from the Azores (45.1%, a difference of 0.22%), Panamanian (45.3%, a difference of 0.24%), and Immigrants from Laos (45.0%, a difference of 0.30%).
| Demographics | Rating | Rank | Currently Married |
| Alaska Natives | 7.0 /100 | #213 | Tragic 45.5% |
| Dutch West Indians | 6.7 /100 | #214 | Tragic 45.5% |
| German Russians | 6.7 /100 | #215 | Tragic 45.5% |
| Immigrants | Morocco | 5.5 /100 | #216 | Tragic 45.4% |
| Immigrants | Thailand | 5.1 /100 | #217 | Tragic 45.4% |
| Panamanians | 4.0 /100 | #218 | Tragic 45.3% |
| Immigrants | Portugal | 3.5 /100 | #219 | Tragic 45.2% |
| Kenyans | 3.1 /100 | #220 | Tragic 45.2% |
| Mexicans | 3.0 /100 | #221 | Tragic 45.2% |
| Immigrants | Azores | 2.5 /100 | #222 | Tragic 45.1% |
| Immigrants | Laos | 2.3 /100 | #223 | Tragic 45.0% |
| Immigrants | Uganda | 2.2 /100 | #224 | Tragic 45.0% |
| French American Indians | 2.2 /100 | #225 | Tragic 45.0% |
| Comanche | 2.1 /100 | #226 | Tragic 45.0% |
| Spanish Americans | 2.1 /100 | #227 | Tragic 45.0% |