Immigrants from Laos vs Arab Unemployment Among Women with Children Under 18 years
COMPARE
Immigrants from Laos
Arab
Unemployment Among Women with Children Under 18 years
Unemployment Among Women with Children Under 18 years Comparison
Immigrants from Laos
Arabs
5.5%
UNEMPLOYMENT AMONG WOMEN WITH CHILDREN UNDER 18 YEARS
38.8/ 100
METRIC RATING
183rd/ 347
METRIC RANK
5.6%
UNEMPLOYMENT AMONG WOMEN WITH CHILDREN UNDER 18 YEARS
21.4/ 100
METRIC RATING
198th/ 347
METRIC RANK
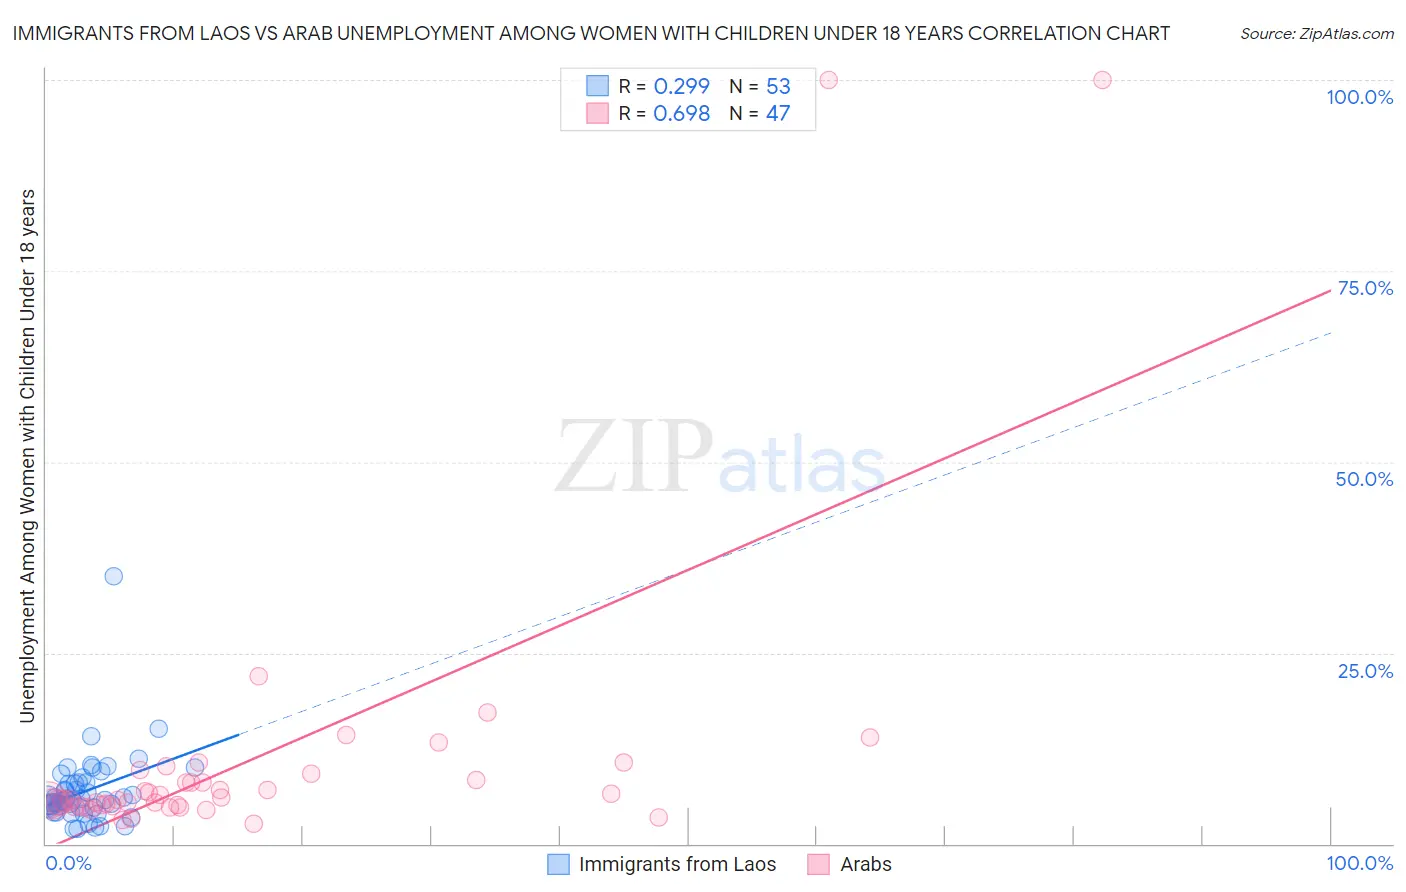
Immigrants from Laos vs Arab Unemployment Among Women with Children Under 18 years Correlation Chart
The statistical analysis conducted on geographies consisting of 197,766,364 people shows a weak positive correlation between the proportion of Immigrants from Laos and unemployment rate among women with children under the age of 18 in the United States with a correlation coefficient (R) of 0.299 and weighted average of 5.5%. Similarly, the statistical analysis conducted on geographies consisting of 460,277,043 people shows a significant positive correlation between the proportion of Arabs and unemployment rate among women with children under the age of 18 in the United States with a correlation coefficient (R) of 0.698 and weighted average of 5.6%, a difference of 1.5%.
Unemployment Among Women with Children Under 18 years Correlation Summary
| Measurement | Immigrants from Laos | Arab |
| Minimum | 2.0% | 2.7% |
| Maximum | 35.0% | 100.0% |
| Range | 33.0% | 97.3% |
| Mean | 6.9% | 11.2% |
| Median | 5.7% | 5.8% |
| Interquartile 25% (IQ1) | 4.8% | 4.9% |
| Interquartile 75% (IQ3) | 8.1% | 9.1% |
| Interquartile Range (IQR) | 3.3% | 4.2% |
| Standard Deviation (Sample) | 4.9% | 19.3% |
| Standard Deviation (Population) | 4.8% | 19.1% |
Demographics Similar to Immigrants from Laos and Arabs by Unemployment Among Women with Children Under 18 years
In terms of unemployment among women with children under 18 years, the demographic groups most similar to Immigrants from Laos are Immigrants from Cambodia (5.5%, a difference of 0.030%), Immigrants from Zaire (5.5%, a difference of 0.050%), Immigrants from Sudan (5.5%, a difference of 0.13%), Indonesian (5.5%, a difference of 0.18%), and Immigrants from Hungary (5.5%, a difference of 0.19%). Similarly, the demographic groups most similar to Arabs are Immigrants from Colombia (5.6%, a difference of 0.0%), Marshallese (5.6%, a difference of 0.13%), Spaniard (5.6%, a difference of 0.14%), Colombian (5.6%, a difference of 0.15%), and Menominee (5.6%, a difference of 0.31%).
| Demographics | Rating | Rank | Unemployment Among Women with Children Under 18 years |
| Immigrants | Southern Europe | 42.7 /100 | #180 | Average 5.5% |
| Immigrants | Hungary | 41.3 /100 | #181 | Average 5.5% |
| Immigrants | Sudan | 40.6 /100 | #182 | Average 5.5% |
| Immigrants | Laos | 38.8 /100 | #183 | Fair 5.5% |
| Immigrants | Cambodia | 38.4 /100 | #184 | Fair 5.5% |
| Immigrants | Zaire | 38.1 /100 | #185 | Fair 5.5% |
| Indonesians | 36.3 /100 | #186 | Fair 5.5% |
| Malaysians | 35.7 /100 | #187 | Fair 5.5% |
| Iraqis | 35.3 /100 | #188 | Fair 5.5% |
| Immigrants | Eritrea | 33.8 /100 | #189 | Fair 5.5% |
| Immigrants | Poland | 31.2 /100 | #190 | Fair 5.5% |
| South American Indians | 30.8 /100 | #191 | Fair 5.5% |
| Immigrants | Spain | 30.7 /100 | #192 | Fair 5.5% |
| Immigrants | Afghanistan | 29.3 /100 | #193 | Fair 5.5% |
| Immigrants | Chile | 29.2 /100 | #194 | Fair 5.5% |
| Colombians | 22.8 /100 | #195 | Fair 5.6% |
| Spaniards | 22.8 /100 | #196 | Fair 5.6% |
| Immigrants | Colombia | 21.4 /100 | #197 | Fair 5.6% |
| Arabs | 21.4 /100 | #198 | Fair 5.6% |
| Marshallese | 20.2 /100 | #199 | Fair 5.6% |
| Menominee | 18.6 /100 | #200 | Poor 5.6% |