Immigrants from Laos vs Immigrants from Russia 10th Grade
COMPARE
Immigrants from Laos
Immigrants from Russia
10th Grade
10th Grade Comparison
Immigrants from Laos
Immigrants from Russia
91.9%
10TH GRADE
0.0/ 100
METRIC RATING
288th/ 347
METRIC RANK
94.3%
10TH GRADE
92.4/ 100
METRIC RATING
132nd/ 347
METRIC RANK
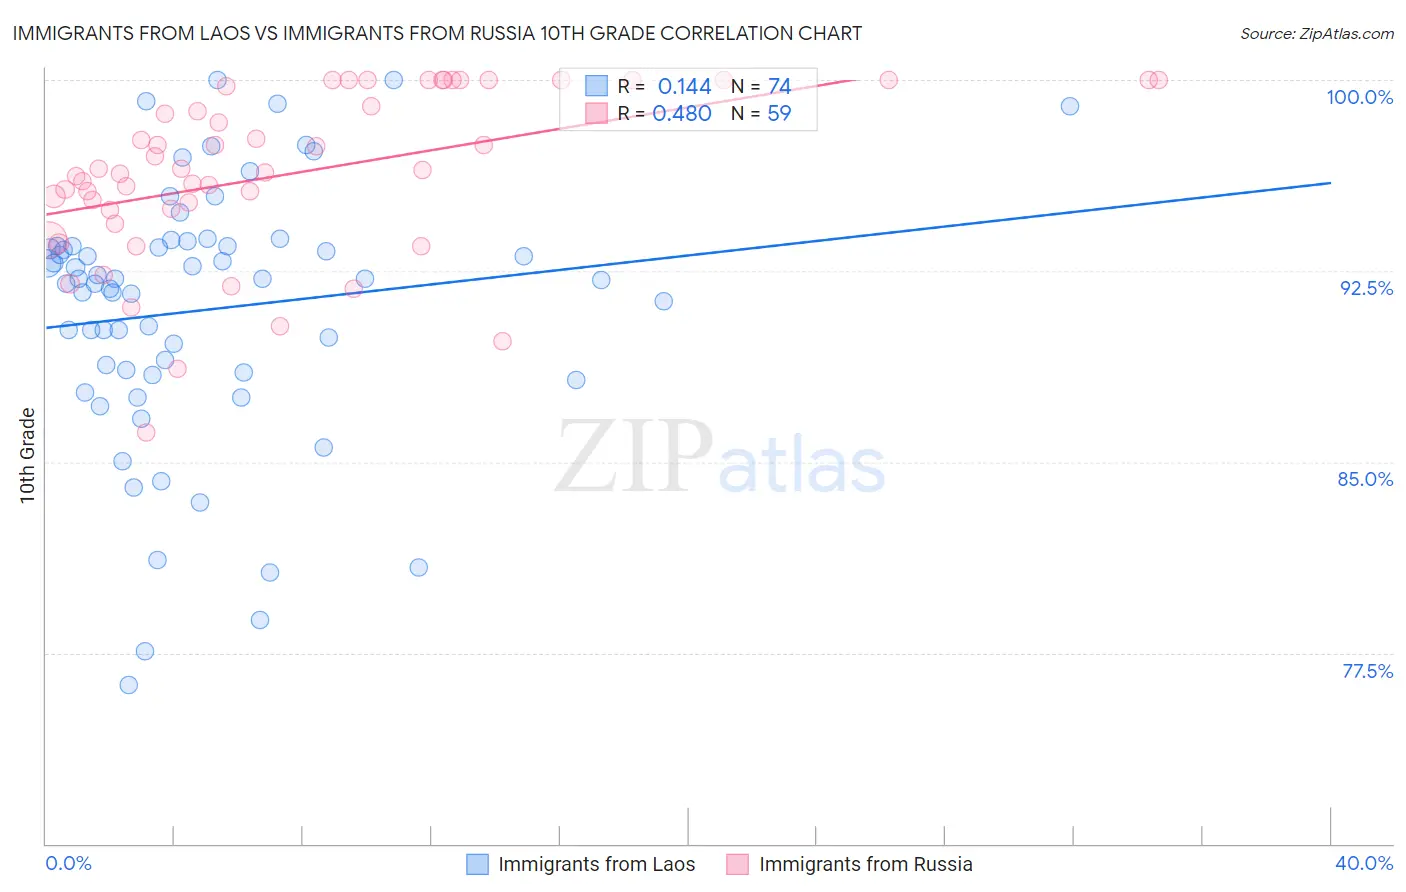
Immigrants from Laos vs Immigrants from Russia 10th Grade Correlation Chart
The statistical analysis conducted on geographies consisting of 201,472,886 people shows a poor positive correlation between the proportion of Immigrants from Laos and percentage of population with at least 10th grade education in the United States with a correlation coefficient (R) of 0.144 and weighted average of 91.9%. Similarly, the statistical analysis conducted on geographies consisting of 347,948,494 people shows a moderate positive correlation between the proportion of Immigrants from Russia and percentage of population with at least 10th grade education in the United States with a correlation coefficient (R) of 0.480 and weighted average of 94.3%, a difference of 2.6%.
10th Grade Correlation Summary
| Measurement | Immigrants from Laos | Immigrants from Russia |
| Minimum | 76.2% | 86.2% |
| Maximum | 100.0% | 100.0% |
| Range | 23.8% | 13.8% |
| Mean | 91.0% | 96.3% |
| Median | 92.2% | 96.5% |
| Interquartile 25% (IQ1) | 88.5% | 94.9% |
| Interquartile 75% (IQ3) | 93.5% | 100.0% |
| Interquartile Range (IQR) | 5.0% | 5.1% |
| Standard Deviation (Sample) | 5.1% | 3.3% |
| Standard Deviation (Population) | 5.1% | 3.3% |
Similar Demographics by 10th Grade
Demographics Similar to Immigrants from Laos by 10th Grade
In terms of 10th grade, the demographic groups most similar to Immigrants from Laos are Pennsylvania German (91.9%, a difference of 0.0%), Sri Lankan (91.8%, a difference of 0.040%), British West Indian (91.8%, a difference of 0.060%), Immigrants from West Indies (91.8%, a difference of 0.060%), and Immigrants from Burma/Myanmar (91.8%, a difference of 0.070%).
| Demographics | Rating | Rank | 10th Grade |
| Bangladeshis | 0.1 /100 | #281 | Tragic 92.2% |
| Immigrants | Peru | 0.1 /100 | #282 | Tragic 92.2% |
| Immigrants | St. Vincent and the Grenadines | 0.0 /100 | #283 | Tragic 92.1% |
| Immigrants | Barbados | 0.0 /100 | #284 | Tragic 92.1% |
| Immigrants | South Eastern Asia | 0.0 /100 | #285 | Tragic 92.1% |
| Yuman | 0.0 /100 | #286 | Tragic 92.0% |
| Pennsylvania Germans | 0.0 /100 | #287 | Tragic 91.9% |
| Immigrants | Laos | 0.0 /100 | #288 | Tragic 91.9% |
| Sri Lankans | 0.0 /100 | #289 | Tragic 91.8% |
| British West Indians | 0.0 /100 | #290 | Tragic 91.8% |
| Immigrants | West Indies | 0.0 /100 | #291 | Tragic 91.8% |
| Immigrants | Burma/Myanmar | 0.0 /100 | #292 | Tragic 91.8% |
| Indonesians | 0.0 /100 | #293 | Tragic 91.8% |
| Haitians | 0.0 /100 | #294 | Tragic 91.8% |
| Lumbee | 0.0 /100 | #295 | Tragic 91.7% |
Demographics Similar to Immigrants from Russia by 10th Grade
In terms of 10th grade, the demographic groups most similar to Immigrants from Russia are Iroquois (94.3%, a difference of 0.010%), Immigrants from Greece (94.3%, a difference of 0.010%), Immigrants from Eastern Europe (94.3%, a difference of 0.010%), Creek (94.2%, a difference of 0.010%), and Osage (94.2%, a difference of 0.020%).
| Demographics | Rating | Rank | 10th Grade |
| Americans | 94.4 /100 | #125 | Exceptional 94.3% |
| Immigrants | Iran | 94.4 /100 | #126 | Exceptional 94.3% |
| Israelis | 93.8 /100 | #127 | Exceptional 94.3% |
| Potawatomi | 93.6 /100 | #128 | Exceptional 94.3% |
| Iroquois | 92.8 /100 | #129 | Exceptional 94.3% |
| Immigrants | Greece | 92.7 /100 | #130 | Exceptional 94.3% |
| Immigrants | Eastern Europe | 92.5 /100 | #131 | Exceptional 94.3% |
| Immigrants | Russia | 92.4 /100 | #132 | Exceptional 94.3% |
| Creek | 91.9 /100 | #133 | Exceptional 94.2% |
| Osage | 91.7 /100 | #134 | Exceptional 94.2% |
| Immigrants | Korea | 91.3 /100 | #135 | Exceptional 94.2% |
| Shoshone | 90.8 /100 | #136 | Exceptional 94.2% |
| Arapaho | 90.5 /100 | #137 | Exceptional 94.2% |
| Immigrants | Sri Lanka | 89.9 /100 | #138 | Excellent 94.2% |
| Immigrants | Bosnia and Herzegovina | 89.4 /100 | #139 | Excellent 94.2% |