Immigrants from Kuwait vs Cajun Unemployment Among Women with Children Ages 6 to 17 years
COMPARE
Immigrants from Kuwait
Cajun
Unemployment Among Women with Children Ages 6 to 17 years
Unemployment Among Women with Children Ages 6 to 17 years Comparison
Immigrants from Kuwait
Cajuns
8.3%
UNEMPLOYMENT AMONG WOMEN WITH CHILDREN AGES 6 TO 17 YEARS
99.9/ 100
METRIC RATING
64th/ 347
METRIC RANK
10.8%
UNEMPLOYMENT AMONG WOMEN WITH CHILDREN AGES 6 TO 17 YEARS
0.0/ 100
METRIC RATING
325th/ 347
METRIC RANK
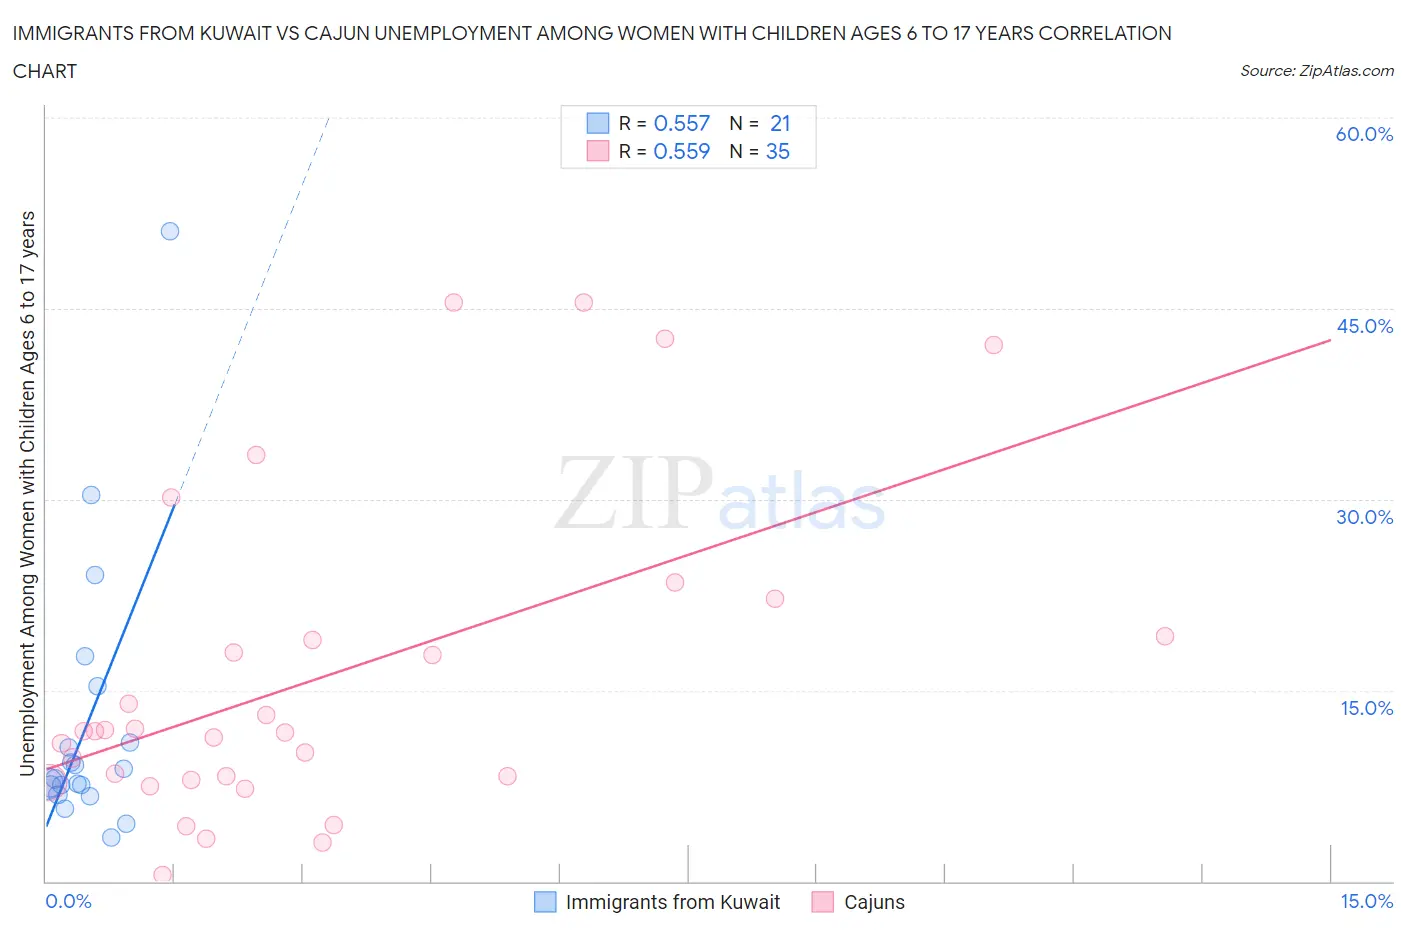
Immigrants from Kuwait vs Cajun Unemployment Among Women with Children Ages 6 to 17 years Correlation Chart
The statistical analysis conducted on geographies consisting of 115,670,322 people shows a substantial positive correlation between the proportion of Immigrants from Kuwait and unemployment rate among women with children between the ages 6 and 17 in the United States with a correlation coefficient (R) of 0.557 and weighted average of 8.3%. Similarly, the statistical analysis conducted on geographies consisting of 120,661,780 people shows a substantial positive correlation between the proportion of Cajuns and unemployment rate among women with children between the ages 6 and 17 in the United States with a correlation coefficient (R) of 0.559 and weighted average of 10.8%, a difference of 31.1%.
Unemployment Among Women with Children Ages 6 to 17 years Correlation Summary
| Measurement | Immigrants from Kuwait | Cajun |
| Minimum | 3.4% | 0.48% |
| Maximum | 51.1% | 45.5% |
| Range | 47.7% | 45.0% |
| Mean | 12.4% | 15.9% |
| Median | 8.0% | 11.8% |
| Interquartile 25% (IQ1) | 7.1% | 8.0% |
| Interquartile 75% (IQ3) | 13.1% | 19.2% |
| Interquartile Range (IQR) | 6.0% | 11.2% |
| Standard Deviation (Sample) | 11.0% | 12.5% |
| Standard Deviation (Population) | 10.7% | 12.3% |
Similar Demographics by Unemployment Among Women with Children Ages 6 to 17 years
Demographics Similar to Immigrants from Kuwait by Unemployment Among Women with Children Ages 6 to 17 years
In terms of unemployment among women with children ages 6 to 17 years, the demographic groups most similar to Immigrants from Kuwait are Immigrants from Albania (8.3%, a difference of 0.090%), Luxembourger (8.3%, a difference of 0.22%), Armenian (8.3%, a difference of 0.33%), Marshallese (8.3%, a difference of 0.41%), and Immigrants from South Eastern Asia (8.2%, a difference of 0.44%).
| Demographics | Rating | Rank | Unemployment Among Women with Children Ages 6 to 17 years |
| Immigrants | Laos | 100.0 /100 | #57 | Exceptional 8.2% |
| Immigrants | Malaysia | 100.0 /100 | #58 | Exceptional 8.2% |
| Immigrants | Philippines | 100.0 /100 | #59 | Exceptional 8.2% |
| Basques | 100.0 /100 | #60 | Exceptional 8.2% |
| Koreans | 100.0 /100 | #61 | Exceptional 8.2% |
| Spanish American Indians | 100.0 /100 | #62 | Exceptional 8.2% |
| Immigrants | South Eastern Asia | 99.9 /100 | #63 | Exceptional 8.2% |
| Immigrants | Kuwait | 99.9 /100 | #64 | Exceptional 8.3% |
| Immigrants | Albania | 99.9 /100 | #65 | Exceptional 8.3% |
| Luxembourgers | 99.9 /100 | #66 | Exceptional 8.3% |
| Armenians | 99.9 /100 | #67 | Exceptional 8.3% |
| Marshallese | 99.9 /100 | #68 | Exceptional 8.3% |
| Immigrants | Thailand | 99.9 /100 | #69 | Exceptional 8.3% |
| Norwegians | 99.9 /100 | #70 | Exceptional 8.3% |
| Immigrants | Australia | 99.8 /100 | #71 | Exceptional 8.3% |
Demographics Similar to Cajuns by Unemployment Among Women with Children Ages 6 to 17 years
In terms of unemployment among women with children ages 6 to 17 years, the demographic groups most similar to Cajuns are Liberian (10.8%, a difference of 0.070%), Cape Verdean (10.9%, a difference of 0.13%), Immigrants from Dominican Republic (10.8%, a difference of 0.18%), Dominican (10.8%, a difference of 0.24%), and Ottawa (10.9%, a difference of 0.27%).
| Demographics | Rating | Rank | Unemployment Among Women with Children Ages 6 to 17 years |
| Delaware | 0.0 /100 | #318 | Tragic 10.5% |
| Immigrants | Uganda | 0.0 /100 | #319 | Tragic 10.7% |
| Apache | 0.0 /100 | #320 | Tragic 10.7% |
| Tohono O'odham | 0.0 /100 | #321 | Tragic 10.7% |
| Cree | 0.0 /100 | #322 | Tragic 10.8% |
| Dominicans | 0.0 /100 | #323 | Tragic 10.8% |
| Immigrants | Dominican Republic | 0.0 /100 | #324 | Tragic 10.8% |
| Cajuns | 0.0 /100 | #325 | Tragic 10.8% |
| Liberians | 0.0 /100 | #326 | Tragic 10.8% |
| Cape Verdeans | 0.0 /100 | #327 | Tragic 10.9% |
| Ottawa | 0.0 /100 | #328 | Tragic 10.9% |
| Pennsylvania Germans | 0.0 /100 | #329 | Tragic 11.0% |
| Chippewa | 0.0 /100 | #330 | Tragic 11.1% |
| Blacks/African Americans | 0.0 /100 | #331 | Tragic 11.4% |
| Tsimshian | 0.0 /100 | #332 | Tragic 11.4% |