Immigrants from Kuwait vs Finnish Unemployment Among Women with Children Ages 6 to 17 years
COMPARE
Immigrants from Kuwait
Finnish
Unemployment Among Women with Children Ages 6 to 17 years
Unemployment Among Women with Children Ages 6 to 17 years Comparison
Immigrants from Kuwait
Finns
8.3%
UNEMPLOYMENT AMONG WOMEN WITH CHILDREN AGES 6 TO 17 YEARS
99.9/ 100
METRIC RATING
64th/ 347
METRIC RANK
9.2%
UNEMPLOYMENT AMONG WOMEN WITH CHILDREN AGES 6 TO 17 YEARS
10.0/ 100
METRIC RATING
210th/ 347
METRIC RANK
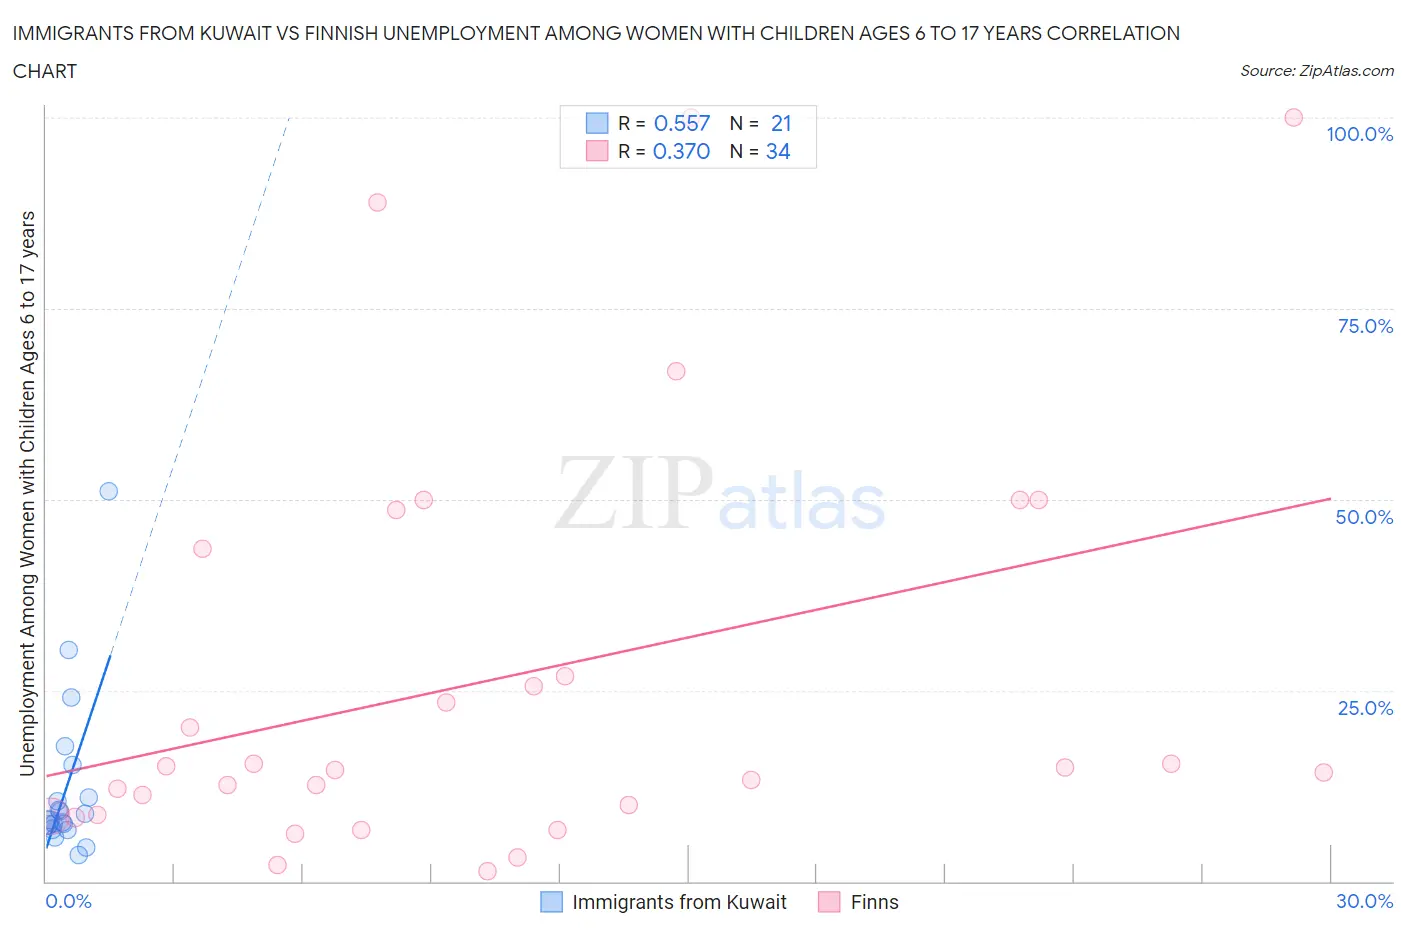
Immigrants from Kuwait vs Finnish Unemployment Among Women with Children Ages 6 to 17 years Correlation Chart
The statistical analysis conducted on geographies consisting of 115,670,322 people shows a substantial positive correlation between the proportion of Immigrants from Kuwait and unemployment rate among women with children between the ages 6 and 17 in the United States with a correlation coefficient (R) of 0.557 and weighted average of 8.3%. Similarly, the statistical analysis conducted on geographies consisting of 277,451,978 people shows a mild positive correlation between the proportion of Finns and unemployment rate among women with children between the ages 6 and 17 in the United States with a correlation coefficient (R) of 0.370 and weighted average of 9.2%, a difference of 11.0%.
Unemployment Among Women with Children Ages 6 to 17 years Correlation Summary
| Measurement | Immigrants from Kuwait | Finnish |
| Minimum | 3.4% | 1.3% |
| Maximum | 51.1% | 100.0% |
| Range | 47.7% | 98.7% |
| Mean | 12.4% | 26.7% |
| Median | 8.0% | 14.7% |
| Interquartile 25% (IQ1) | 7.1% | 8.6% |
| Interquartile 75% (IQ3) | 13.1% | 43.5% |
| Interquartile Range (IQR) | 6.0% | 34.9% |
| Standard Deviation (Sample) | 11.0% | 27.4% |
| Standard Deviation (Population) | 10.7% | 27.0% |
Similar Demographics by Unemployment Among Women with Children Ages 6 to 17 years
Demographics Similar to Immigrants from Kuwait by Unemployment Among Women with Children Ages 6 to 17 years
In terms of unemployment among women with children ages 6 to 17 years, the demographic groups most similar to Immigrants from Kuwait are Immigrants from Albania (8.3%, a difference of 0.090%), Luxembourger (8.3%, a difference of 0.22%), Armenian (8.3%, a difference of 0.33%), Marshallese (8.3%, a difference of 0.41%), and Immigrants from South Eastern Asia (8.2%, a difference of 0.44%).
| Demographics | Rating | Rank | Unemployment Among Women with Children Ages 6 to 17 years |
| Immigrants | Laos | 100.0 /100 | #57 | Exceptional 8.2% |
| Immigrants | Malaysia | 100.0 /100 | #58 | Exceptional 8.2% |
| Immigrants | Philippines | 100.0 /100 | #59 | Exceptional 8.2% |
| Basques | 100.0 /100 | #60 | Exceptional 8.2% |
| Koreans | 100.0 /100 | #61 | Exceptional 8.2% |
| Spanish American Indians | 100.0 /100 | #62 | Exceptional 8.2% |
| Immigrants | South Eastern Asia | 99.9 /100 | #63 | Exceptional 8.2% |
| Immigrants | Kuwait | 99.9 /100 | #64 | Exceptional 8.3% |
| Immigrants | Albania | 99.9 /100 | #65 | Exceptional 8.3% |
| Luxembourgers | 99.9 /100 | #66 | Exceptional 8.3% |
| Armenians | 99.9 /100 | #67 | Exceptional 8.3% |
| Marshallese | 99.9 /100 | #68 | Exceptional 8.3% |
| Immigrants | Thailand | 99.9 /100 | #69 | Exceptional 8.3% |
| Norwegians | 99.9 /100 | #70 | Exceptional 8.3% |
| Immigrants | Australia | 99.8 /100 | #71 | Exceptional 8.3% |
Demographics Similar to Finns by Unemployment Among Women with Children Ages 6 to 17 years
In terms of unemployment among women with children ages 6 to 17 years, the demographic groups most similar to Finns are Immigrants from Cuba (9.2%, a difference of 0.050%), Salvadoran (9.2%, a difference of 0.090%), Cuban (9.2%, a difference of 0.10%), Immigrants from Peru (9.2%, a difference of 0.10%), and Peruvian (9.2%, a difference of 0.13%).
| Demographics | Rating | Rank | Unemployment Among Women with Children Ages 6 to 17 years |
| Maltese | 15.3 /100 | #203 | Poor 9.1% |
| Immigrants | Canada | 15.3 /100 | #204 | Poor 9.1% |
| Immigrants | Western Europe | 14.1 /100 | #205 | Poor 9.1% |
| Immigrants | North America | 12.7 /100 | #206 | Poor 9.2% |
| Cubans | 10.9 /100 | #207 | Poor 9.2% |
| Immigrants | Peru | 10.8 /100 | #208 | Poor 9.2% |
| Salvadorans | 10.7 /100 | #209 | Poor 9.2% |
| Finns | 10.0 /100 | #210 | Tragic 9.2% |
| Immigrants | Cuba | 9.6 /100 | #211 | Tragic 9.2% |
| Peruvians | 9.0 /100 | #212 | Tragic 9.2% |
| Spaniards | 8.2 /100 | #213 | Tragic 9.2% |
| Iroquois | 7.5 /100 | #214 | Tragic 9.2% |
| Immigrants | Germany | 7.2 /100 | #215 | Tragic 9.2% |
| Immigrants | Uruguay | 7.2 /100 | #216 | Tragic 9.2% |
| Germans | 7.2 /100 | #217 | Tragic 9.2% |