French vs Cajun Unemployment Among Women with Children Ages 6 to 17 years
COMPARE
French
Cajun
Unemployment Among Women with Children Ages 6 to 17 years
Unemployment Among Women with Children Ages 6 to 17 years Comparison
French
Cajuns
9.7%
UNEMPLOYMENT AMONG WOMEN WITH CHILDREN AGES 6 TO 17 YEARS
0.1/ 100
METRIC RATING
278th/ 347
METRIC RANK
10.8%
UNEMPLOYMENT AMONG WOMEN WITH CHILDREN AGES 6 TO 17 YEARS
0.0/ 100
METRIC RATING
325th/ 347
METRIC RANK
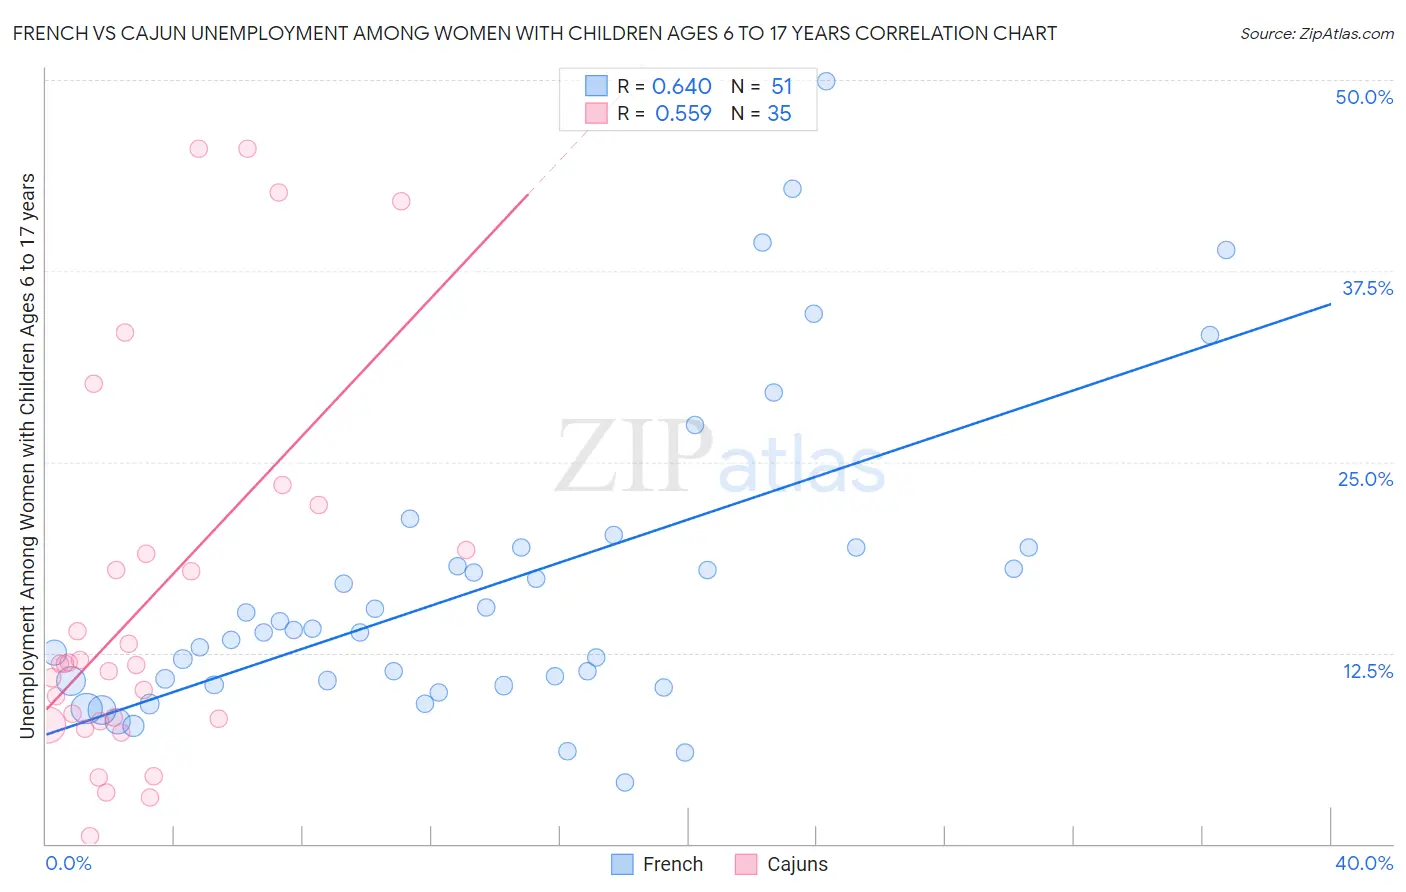
French vs Cajun Unemployment Among Women with Children Ages 6 to 17 years Correlation Chart
The statistical analysis conducted on geographies consisting of 357,857,640 people shows a significant positive correlation between the proportion of French and unemployment rate among women with children between the ages 6 and 17 in the United States with a correlation coefficient (R) of 0.640 and weighted average of 9.7%. Similarly, the statistical analysis conducted on geographies consisting of 120,661,780 people shows a substantial positive correlation between the proportion of Cajuns and unemployment rate among women with children between the ages 6 and 17 in the United States with a correlation coefficient (R) of 0.559 and weighted average of 10.8%, a difference of 11.8%.
Unemployment Among Women with Children Ages 6 to 17 years Correlation Summary
| Measurement | French | Cajun |
| Minimum | 4.0% | 0.48% |
| Maximum | 49.9% | 45.5% |
| Range | 45.9% | 45.0% |
| Mean | 16.8% | 15.9% |
| Median | 13.8% | 11.8% |
| Interquartile 25% (IQ1) | 10.4% | 8.0% |
| Interquartile 75% (IQ3) | 19.4% | 19.2% |
| Interquartile Range (IQR) | 9.0% | 11.2% |
| Standard Deviation (Sample) | 10.0% | 12.5% |
| Standard Deviation (Population) | 9.9% | 12.3% |
Similar Demographics by Unemployment Among Women with Children Ages 6 to 17 years
Demographics Similar to French by Unemployment Among Women with Children Ages 6 to 17 years
In terms of unemployment among women with children ages 6 to 17 years, the demographic groups most similar to French are Scotch-Irish (9.7%, a difference of 0.030%), British West Indian (9.7%, a difference of 0.070%), Immigrants from Portugal (9.7%, a difference of 0.12%), U.S. Virgin Islander (9.7%, a difference of 0.13%), and Seminole (9.7%, a difference of 0.22%).
| Demographics | Rating | Rank | Unemployment Among Women with Children Ages 6 to 17 years |
| Immigrants | Latin America | 0.1 /100 | #271 | Tragic 9.6% |
| Kiowa | 0.1 /100 | #272 | Tragic 9.6% |
| Whites/Caucasians | 0.1 /100 | #273 | Tragic 9.6% |
| Aleuts | 0.1 /100 | #274 | Tragic 9.6% |
| U.S. Virgin Islanders | 0.1 /100 | #275 | Tragic 9.7% |
| Immigrants | Portugal | 0.1 /100 | #276 | Tragic 9.7% |
| British West Indians | 0.1 /100 | #277 | Tragic 9.7% |
| French | 0.1 /100 | #278 | Tragic 9.7% |
| Scotch-Irish | 0.1 /100 | #279 | Tragic 9.7% |
| Seminole | 0.1 /100 | #280 | Tragic 9.7% |
| Jamaicans | 0.0 /100 | #281 | Tragic 9.8% |
| Slovaks | 0.0 /100 | #282 | Tragic 9.8% |
| Central American Indians | 0.0 /100 | #283 | Tragic 9.9% |
| Yakama | 0.0 /100 | #284 | Tragic 9.9% |
| Hispanics or Latinos | 0.0 /100 | #285 | Tragic 9.9% |
Demographics Similar to Cajuns by Unemployment Among Women with Children Ages 6 to 17 years
In terms of unemployment among women with children ages 6 to 17 years, the demographic groups most similar to Cajuns are Liberian (10.8%, a difference of 0.070%), Cape Verdean (10.9%, a difference of 0.13%), Immigrants from Dominican Republic (10.8%, a difference of 0.18%), Dominican (10.8%, a difference of 0.24%), and Ottawa (10.9%, a difference of 0.27%).
| Demographics | Rating | Rank | Unemployment Among Women with Children Ages 6 to 17 years |
| Delaware | 0.0 /100 | #318 | Tragic 10.5% |
| Immigrants | Uganda | 0.0 /100 | #319 | Tragic 10.7% |
| Apache | 0.0 /100 | #320 | Tragic 10.7% |
| Tohono O'odham | 0.0 /100 | #321 | Tragic 10.7% |
| Cree | 0.0 /100 | #322 | Tragic 10.8% |
| Dominicans | 0.0 /100 | #323 | Tragic 10.8% |
| Immigrants | Dominican Republic | 0.0 /100 | #324 | Tragic 10.8% |
| Cajuns | 0.0 /100 | #325 | Tragic 10.8% |
| Liberians | 0.0 /100 | #326 | Tragic 10.8% |
| Cape Verdeans | 0.0 /100 | #327 | Tragic 10.9% |
| Ottawa | 0.0 /100 | #328 | Tragic 10.9% |
| Pennsylvania Germans | 0.0 /100 | #329 | Tragic 11.0% |
| Chippewa | 0.0 /100 | #330 | Tragic 11.1% |
| Blacks/African Americans | 0.0 /100 | #331 | Tragic 11.4% |
| Tsimshian | 0.0 /100 | #332 | Tragic 11.4% |