Immigrants from Kenya vs Lithuanian Unemployment Among Women with Children Ages 6 to 17 years
COMPARE
Immigrants from Kenya
Lithuanian
Unemployment Among Women with Children Ages 6 to 17 years
Unemployment Among Women with Children Ages 6 to 17 years Comparison
Immigrants from Kenya
Lithuanians
8.8%
UNEMPLOYMENT AMONG WOMEN WITH CHILDREN AGES 6 TO 17 YEARS
86.1/ 100
METRIC RATING
143rd/ 347
METRIC RANK
9.4%
UNEMPLOYMENT AMONG WOMEN WITH CHILDREN AGES 6 TO 17 YEARS
0.9/ 100
METRIC RATING
255th/ 347
METRIC RANK
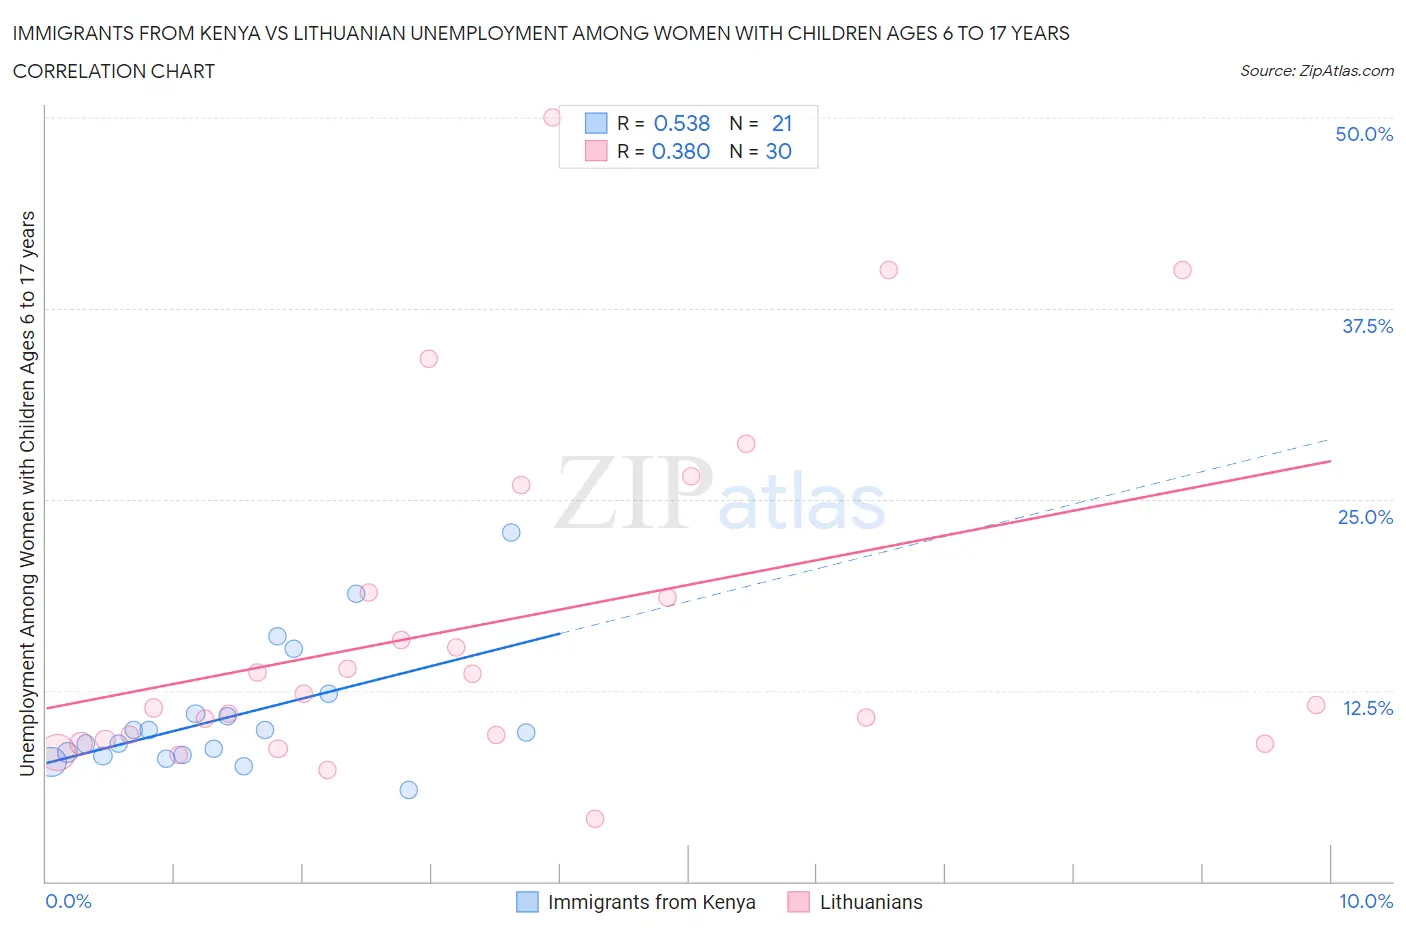
Immigrants from Kenya vs Lithuanian Unemployment Among Women with Children Ages 6 to 17 years Correlation Chart
The statistical analysis conducted on geographies consisting of 177,643,514 people shows a substantial positive correlation between the proportion of Immigrants from Kenya and unemployment rate among women with children between the ages 6 and 17 in the United States with a correlation coefficient (R) of 0.538 and weighted average of 8.8%. Similarly, the statistical analysis conducted on geographies consisting of 288,737,051 people shows a mild positive correlation between the proportion of Lithuanians and unemployment rate among women with children between the ages 6 and 17 in the United States with a correlation coefficient (R) of 0.380 and weighted average of 9.4%, a difference of 7.4%.
Unemployment Among Women with Children Ages 6 to 17 years Correlation Summary
| Measurement | Immigrants from Kenya | Lithuanian |
| Minimum | 5.9% | 4.1% |
| Maximum | 22.8% | 50.0% |
| Range | 16.9% | 45.9% |
| Mean | 10.8% | 16.9% |
| Median | 9.7% | 11.9% |
| Interquartile 25% (IQ1) | 8.2% | 9.3% |
| Interquartile 75% (IQ3) | 11.6% | 18.9% |
| Interquartile Range (IQR) | 3.4% | 9.6% |
| Standard Deviation (Sample) | 4.1% | 11.4% |
| Standard Deviation (Population) | 4.0% | 11.2% |
Similar Demographics by Unemployment Among Women with Children Ages 6 to 17 years
Demographics Similar to Immigrants from Kenya by Unemployment Among Women with Children Ages 6 to 17 years
In terms of unemployment among women with children ages 6 to 17 years, the demographic groups most similar to Immigrants from Kenya are Russian (8.8%, a difference of 0.030%), Kenyan (8.8%, a difference of 0.050%), Immigrants from Austria (8.8%, a difference of 0.13%), Serbian (8.8%, a difference of 0.15%), and Immigrants from Poland (8.8%, a difference of 0.22%).
| Demographics | Rating | Rank | Unemployment Among Women with Children Ages 6 to 17 years |
| Immigrants | Latvia | 90.4 /100 | #136 | Exceptional 8.7% |
| Immigrants | Argentina | 90.0 /100 | #137 | Excellent 8.7% |
| Immigrants | Ethiopia | 89.5 /100 | #138 | Excellent 8.8% |
| Northern Europeans | 89.2 /100 | #139 | Excellent 8.8% |
| Immigrants | Poland | 88.3 /100 | #140 | Excellent 8.8% |
| Serbians | 87.6 /100 | #141 | Excellent 8.8% |
| Immigrants | Austria | 87.5 /100 | #142 | Excellent 8.8% |
| Immigrants | Kenya | 86.1 /100 | #143 | Excellent 8.8% |
| Russians | 85.8 /100 | #144 | Excellent 8.8% |
| Kenyans | 85.6 /100 | #145 | Excellent 8.8% |
| Chileans | 80.8 /100 | #146 | Excellent 8.8% |
| Immigrants | Bangladesh | 79.4 /100 | #147 | Good 8.8% |
| Costa Ricans | 77.0 /100 | #148 | Good 8.8% |
| Croatians | 76.0 /100 | #149 | Good 8.8% |
| Greeks | 75.2 /100 | #150 | Good 8.9% |
Demographics Similar to Lithuanians by Unemployment Among Women with Children Ages 6 to 17 years
In terms of unemployment among women with children ages 6 to 17 years, the demographic groups most similar to Lithuanians are Nicaraguan (9.4%, a difference of 0.060%), Canadian (9.4%, a difference of 0.17%), Celtic (9.5%, a difference of 0.19%), Portuguese (9.4%, a difference of 0.23%), and Immigrants from Mexico (9.5%, a difference of 0.28%).
| Demographics | Rating | Rank | Unemployment Among Women with Children Ages 6 to 17 years |
| Dutch | 1.5 /100 | #248 | Tragic 9.4% |
| Immigrants | South America | 1.5 /100 | #249 | Tragic 9.4% |
| Immigrants | Guatemala | 1.3 /100 | #250 | Tragic 9.4% |
| Central Americans | 1.3 /100 | #251 | Tragic 9.4% |
| Creek | 1.2 /100 | #252 | Tragic 9.4% |
| Portuguese | 1.1 /100 | #253 | Tragic 9.4% |
| Nicaraguans | 1.0 /100 | #254 | Tragic 9.4% |
| Lithuanians | 0.9 /100 | #255 | Tragic 9.4% |
| Canadians | 0.8 /100 | #256 | Tragic 9.4% |
| Celtics | 0.7 /100 | #257 | Tragic 9.5% |
| Immigrants | Mexico | 0.7 /100 | #258 | Tragic 9.5% |
| Immigrants | Central America | 0.6 /100 | #259 | Tragic 9.5% |
| Italians | 0.6 /100 | #260 | Tragic 9.5% |
| South Americans | 0.5 /100 | #261 | Tragic 9.5% |
| Senegalese | 0.5 /100 | #262 | Tragic 9.5% |