Immigrants from Jamaica vs Immigrants from Western Europe Seniors Poverty Over the Age of 65
COMPARE
Immigrants from Jamaica
Immigrants from Western Europe
Seniors Poverty Over the Age of 65
Seniors Poverty Over the Age of 65 Comparison
Immigrants from Jamaica
Immigrants from Western Europe
13.9%
SENIORS POVERTY OVER THE AGE OF 65
0.0/ 100
METRIC RATING
296th/ 347
METRIC RANK
10.4%
SENIORS POVERTY OVER THE AGE OF 65
91.1/ 100
METRIC RATING
119th/ 347
METRIC RANK
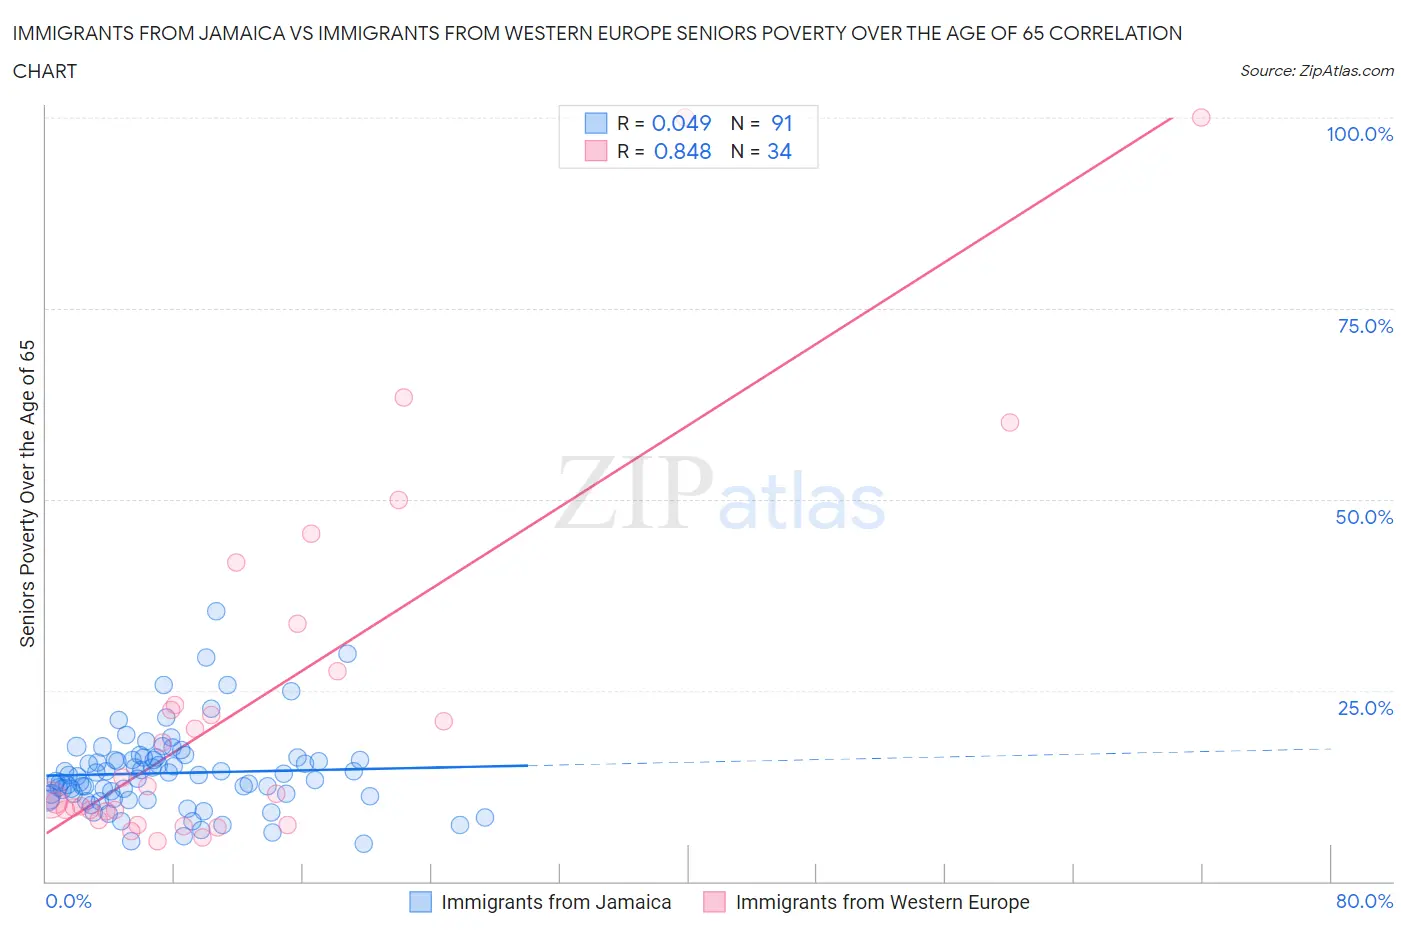
Immigrants from Jamaica vs Immigrants from Western Europe Seniors Poverty Over the Age of 65 Correlation Chart
The statistical analysis conducted on geographies consisting of 300,696,511 people shows no correlation between the proportion of Immigrants from Jamaica and poverty level among seniors over the age of 65 in the United States with a correlation coefficient (R) of 0.049 and weighted average of 13.9%. Similarly, the statistical analysis conducted on geographies consisting of 491,602,141 people shows a very strong positive correlation between the proportion of Immigrants from Western Europe and poverty level among seniors over the age of 65 in the United States with a correlation coefficient (R) of 0.848 and weighted average of 10.4%, a difference of 34.5%.
Seniors Poverty Over the Age of 65 Correlation Summary
| Measurement | Immigrants from Jamaica | Immigrants from Western Europe |
| Minimum | 4.9% | 5.2% |
| Maximum | 35.4% | 100.0% |
| Range | 30.5% | 94.8% |
| Mean | 14.2% | 24.1% |
| Median | 13.7% | 12.0% |
| Interquartile 25% (IQ1) | 10.8% | 9.2% |
| Interquartile 75% (IQ3) | 15.9% | 27.6% |
| Interquartile Range (IQR) | 5.1% | 18.3% |
| Standard Deviation (Sample) | 5.3% | 24.9% |
| Standard Deviation (Population) | 5.3% | 24.5% |
Similar Demographics by Seniors Poverty Over the Age of 65
Demographics Similar to Immigrants from Jamaica by Seniors Poverty Over the Age of 65
In terms of seniors poverty over the age of 65, the demographic groups most similar to Immigrants from Jamaica are Vietnamese (14.0%, a difference of 0.070%), Apache (13.9%, a difference of 0.27%), Immigrants from Belize (14.0%, a difference of 0.36%), Ecuadorian (14.0%, a difference of 0.43%), and Cheyenne (13.9%, a difference of 0.46%).
| Demographics | Rating | Rank | Seniors Poverty Over the Age of 65 |
| Jamaicans | 0.0 /100 | #289 | Tragic 13.6% |
| Immigrants | Central America | 0.0 /100 | #290 | Tragic 13.6% |
| Blacks/African Americans | 0.0 /100 | #291 | Tragic 13.7% |
| Spanish American Indians | 0.0 /100 | #292 | Tragic 13.8% |
| Immigrants | Guatemala | 0.0 /100 | #293 | Tragic 13.8% |
| Cheyenne | 0.0 /100 | #294 | Tragic 13.9% |
| Apache | 0.0 /100 | #295 | Tragic 13.9% |
| Immigrants | Jamaica | 0.0 /100 | #296 | Tragic 13.9% |
| Vietnamese | 0.0 /100 | #297 | Tragic 14.0% |
| Immigrants | Belize | 0.0 /100 | #298 | Tragic 14.0% |
| Ecuadorians | 0.0 /100 | #299 | Tragic 14.0% |
| Immigrants | Uzbekistan | 0.0 /100 | #300 | Tragic 14.0% |
| U.S. Virgin Islanders | 0.0 /100 | #301 | Tragic 14.0% |
| Yup'ik | 0.0 /100 | #302 | Tragic 14.1% |
| Immigrants | Bangladesh | 0.0 /100 | #303 | Tragic 14.1% |
Demographics Similar to Immigrants from Western Europe by Seniors Poverty Over the Age of 65
In terms of seniors poverty over the age of 65, the demographic groups most similar to Immigrants from Western Europe are Immigrants from Bosnia and Herzegovina (10.4%, a difference of 0.060%), Immigrants from Iraq (10.4%, a difference of 0.10%), Immigrants from Moldova (10.4%, a difference of 0.11%), Okinawan (10.4%, a difference of 0.19%), and Lebanese (10.3%, a difference of 0.27%).
| Demographics | Rating | Rank | Seniors Poverty Over the Age of 65 |
| Immigrants | Korea | 93.3 /100 | #112 | Exceptional 10.3% |
| Immigrants | Romania | 93.3 /100 | #113 | Exceptional 10.3% |
| Immigrants | Denmark | 92.7 /100 | #114 | Exceptional 10.3% |
| Immigrants | Italy | 92.6 /100 | #115 | Exceptional 10.3% |
| Pakistanis | 92.2 /100 | #116 | Exceptional 10.3% |
| Lebanese | 92.0 /100 | #117 | Exceptional 10.3% |
| Okinawans | 91.7 /100 | #118 | Exceptional 10.4% |
| Immigrants | Western Europe | 91.1 /100 | #119 | Exceptional 10.4% |
| Immigrants | Bosnia and Herzegovina | 90.8 /100 | #120 | Exceptional 10.4% |
| Immigrants | Iraq | 90.7 /100 | #121 | Exceptional 10.4% |
| Immigrants | Moldova | 90.7 /100 | #122 | Exceptional 10.4% |
| Hmong | 90.0 /100 | #123 | Exceptional 10.4% |
| Asians | 89.9 /100 | #124 | Excellent 10.4% |
| Immigrants | Philippines | 89.4 /100 | #125 | Excellent 10.4% |
| Immigrants | Hungary | 89.1 /100 | #126 | Excellent 10.4% |